CFD Simulation with Phase Change

mollierSolver is an unsteady, density-based RANS-solver which models the Mollier-T-H-X-diagram. It was developed to be used with OpenFOAM. The first implementation was designed for the system ice/water/vapour from -50 to 100°C. All possible phase changes in the carrier fluid (air) are modelled, i.e. evaporation, condensation, melting, crystallization, sublimation and re-sublimation. The solver is extremely versatile and applicable for any condensation and evaporation simulation (not only those of ice/water/vapour). In a later development of the solver, we adapted it for the use of arbitrary substances.
The use cases for mollierSolver are manifold. In principle, it can be used for all problems where phase change is relevant. This could be problems in AC systems (humidity in clean rooms, rooms with electronic equipment, …) or in industrial cooling processes. Unwanted condensation (e.g. recuperation of off-heat in dryers, cooling in film-extrusion plants, condensation on walls and ceilings of production facilities, etc.) can be simulated and processes can be optimized further.
We have designed our code with flexibility in mind. Therefore, we can tune a number of model parameters, and deal with issues like adsorption / desorption problems and conjugate heat transfer from/to solids. This allows us to define specific evaporation and condensation rates for arbitrary parts of geometries, including the full effect of heat transfer from fluid to solid phases. Effectively, this gives us a model for adsorption (chemisorption and physisorption) for CFD simulations. Would you like to know how the fluid mechanics influence the activity of a catalyzer, or how to optimize a fixed adsorption bed? There is a plethora of industrial applications, from protein adsorption on implants and other biomaterial to adsorption chillers, where these mechanisms play a crucial role.
A practical example, which mostly everybody has experienced, is the de-fogging of a windshield. The following video shows the defogging of the windshield and the driver side window under heavy winter conditions.
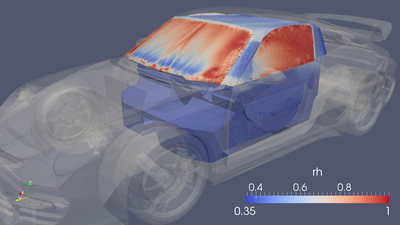
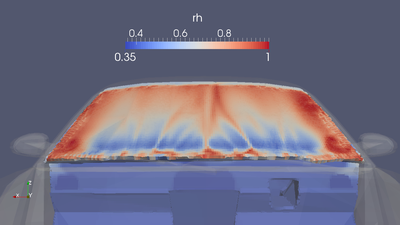
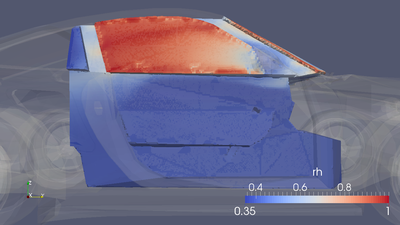
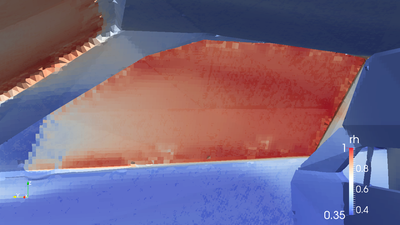
In the images of the simulation results, you can see the distribution of relative humidity in the range of 35 to 100%, both in the interior and on the fogged windows of a sports car, 10 seconds after turning on the front fan and heating. When the relative humidity reaches 100% (red areas) water condenses as small droplets, impeding the driver’s view through the windshield. Warm air reduces relative humidity (blue areas), causing water droplets to evaporate and allowing for a free, unobstructed view.
If you are wondering why the blue areas are already de-fogged after 10 seconds: this specific simulation does not take the engine’s warm-up phase into account. Within the simulation, warm air is immediately available. However, it would of course be possible to account for this effect as well.


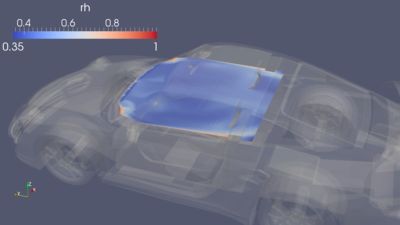
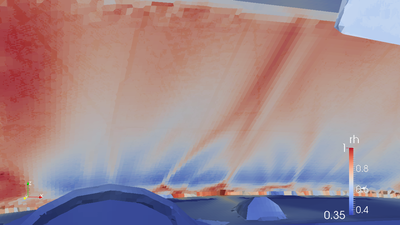
From the driver’s perspective:


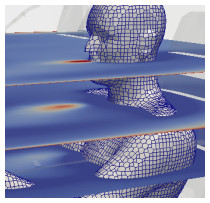
As you can see, the model can realistically predict the influence of breathing persons on the spatial distribution of humidity in closed spaces. In fact, any moisture source can be defined.
Validation of CFD Code
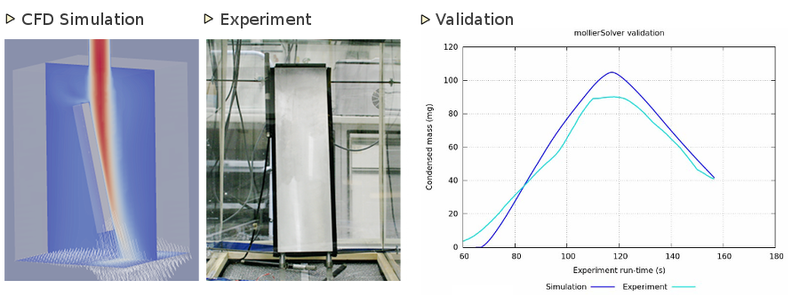
To test the performance of mollierSolver under real-world conditions, we designed an experimental set-up for fogging and de-fogging. The experiment was done in a sealed glass chamber containing a polished metal mirror. The mirror was well insulated on its backside and kept at constant temperature (+/- 0.01 K), ensured by a very sensitive thermostat. From the top of the glass chamber, we then blew in an impinging free-jet at a certain temperature with constant humidity, just a bit below its saturation loading. When the humid air jet hits the cool mirror, it cools down and water precipitates out of the jet onto the mirror. The condensation and evaporation rates to and from the metal surface are measured (by recording the energy needed to keep the polished metal surface at constant temperature) and compared to simulation results.

In essence, the experiment is very similar to what you experience when you switch on the hot water in a cold bathroom: warm, humid air rises and the mirror above the tap is fogging over within a couple of seconds.
The video below shows the experiment in action: the left panel shows the polished metal mirror (at the beginning, you can even see the camera stand, if you look closely), the middle panel shows the condensation in the simulation (blue means dry, and the redder the surface becomes, the more humidity is condensed) and the graph on the right side compares the total condensed mass on the metal surface of the experiment (light blue) and the simulation (dark blue).
If your particular project involves flow and phase change, from drying processes to infectious disease, from fogging to sensor technology - we are here to help! Drop us a few lines, and let’s talk! The first consultation is always free!
Published: