Cold air flow
Background
Early in 2025 Rheologic was contacted by Verein Freies Donaufeld, an Austrian non-profit organisation. Verein Freies Donaufeld strives to preserve farming land, natural habitats of protected species and local microclimate in a previously mostly undeveloped area in Vienna. To support their argumentation we provided a study of night time cooling (local microclimate) for the Donaufeld area and its surroundings. Night time cooling was simulated for windless summer nights with clear skies using detailed 3D data provided by the Austrian Federal Office of Metrology and Surveying, OpenStreetMap and ECMWF weather data as inputs. Simulation results were compared to IR (infrared) surface temperature measurements and literature data and showed good agreement to previously published results.
Location and geometry
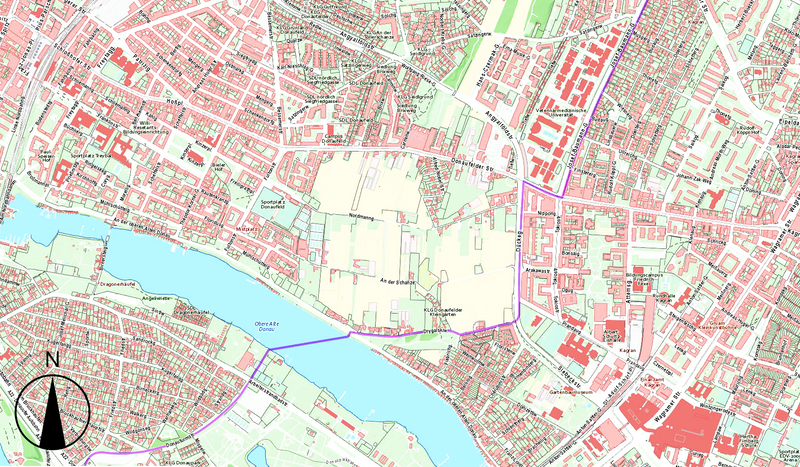
Donaufeld area is located close to an old branch of the Danube river at Lat/Lon = 48.250/16.419.
The south-eastern part of Donaufeld was repurposed and construction activity is ongoing at the time of writing. Existing and planned building, street and landscape geometries were included in the 3D model on a best effort basis (using publicly available building plans). The image below gives an overview of the simulated area and the surrounding built environment.
City map with location of Donaufeld area, source: wien.at/stadtplan (time of request: 20240322-1020)

3D geometry implementation
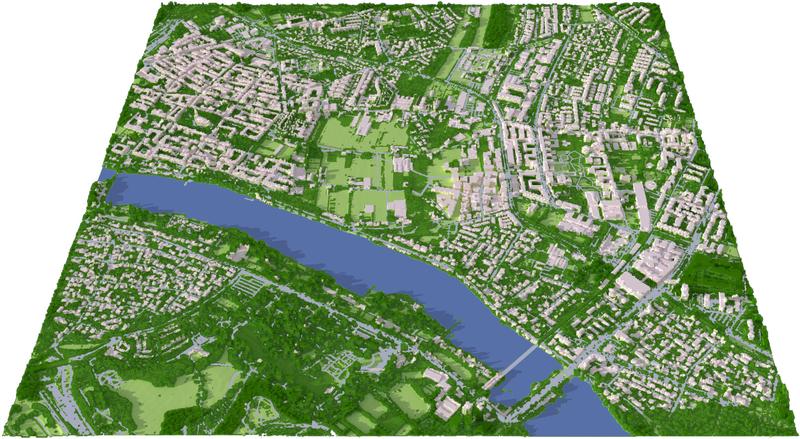
The 3D geometry is building resolved using a lateral grid resolution of 3m. Vegetation, streets, water bodies and bridges are included and resolved in the geometry. Donaufeld lies roughly at the center of the geometry. The area is generally rather flat with absolute height differences in the single digit meter range. The image below shows the actual 3D implementation used for simulating night-time cooling effects. Planned and newly constructed buildings are included.
Overview of simulated geometry

Model
Cold air simulation using density based, finite Volume Navier-Stokes solver with turbulence modeling (uRANS) based on CFD software library OpenFOAM(R) Version v2412.
Transient simulation until pseudo-equilibrium flow state is reached. Simulation starts after sunset. Wind still, clear sky conditions are simulated. The flow is driven by density gradients. Building geometries, vegetation zones, local cooling rates, evapotranspiration and ground topography are input parameters.
We employ a 3D simulation method that is fully height resolved (not modeled).
Analysis of the instantaneous flow field after equilibration
Constant cooling rates for cool air sources
Data sources – Topography: BEV ALS Digital Terrain Model, BEV ALS Digital Surface Model, Buildings and streets: OpenStreetMap, Optical satellite data: Google Inc., segmented vegetation zones: own work, buildings on new construction sites: modeled after publicly available plans and documentation
Forests and tree groups: resolved vegetation zones with local resistance parameters
Meadows and undeveloped areas are segmented from densely built areas and local cooling rates modeled accordingly
The whole simulation domain is resolved laterally at 3.0m
Modeling of turbulent atmospheric boundary layer with ABL-modified k-epsilon model
Ground adjacent cell sizes: lateral {x,y}=3.0m, vertical {z}=1.2m
Extent of simulated domain: 2,8 x 2,8 km² with Donaufeld area at its center
Cool air transport definition
c = U . DeltaT, DeltaT = T - Tr
c … Cool air transport (Km/s)
U … Local flow velocity (m/s)
DeltaT … Temperature difference between local temperature (T) and reference temperature (Tr) (K)
Results
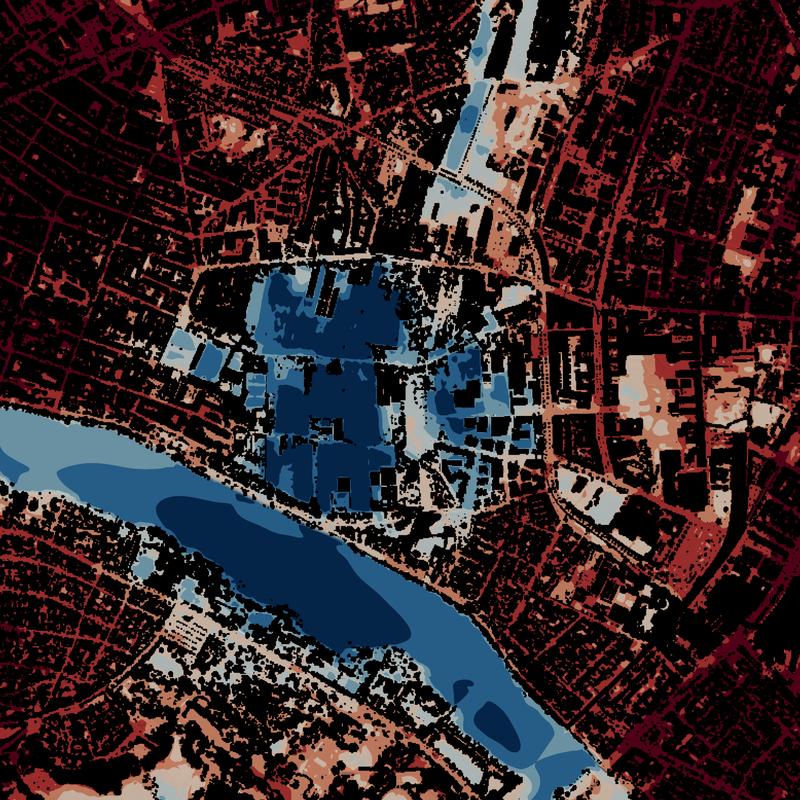
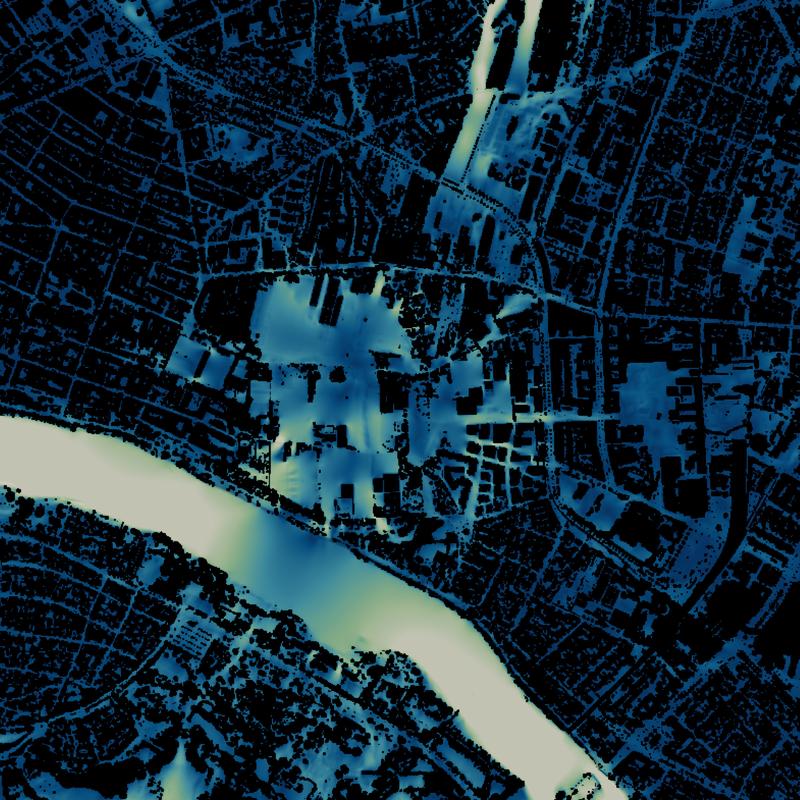
Air temperature at pedestrian level
Air temperature at pedestrian level (1.5m above ground level) two hours after sunset. Dark blue is 4°C cooler than dark red.

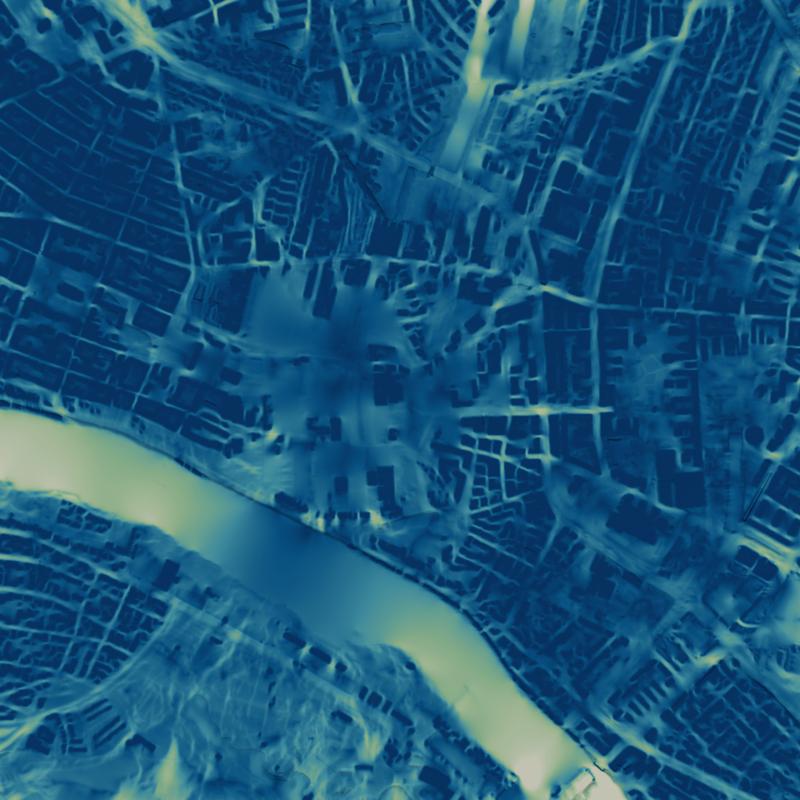
Density gradient driven air velocity at pedestrian level
Air velocity at pedestrian level (1.5m above ground level) two hours after sunset. Blue: 0m/s, green: 0.5m/s.

Cool air transport at pedestrian level
Cool air transport at pedestrian level (1.5m above ground level) two hours after sunset. Vegetation and buildings are coloured black for better visibility.

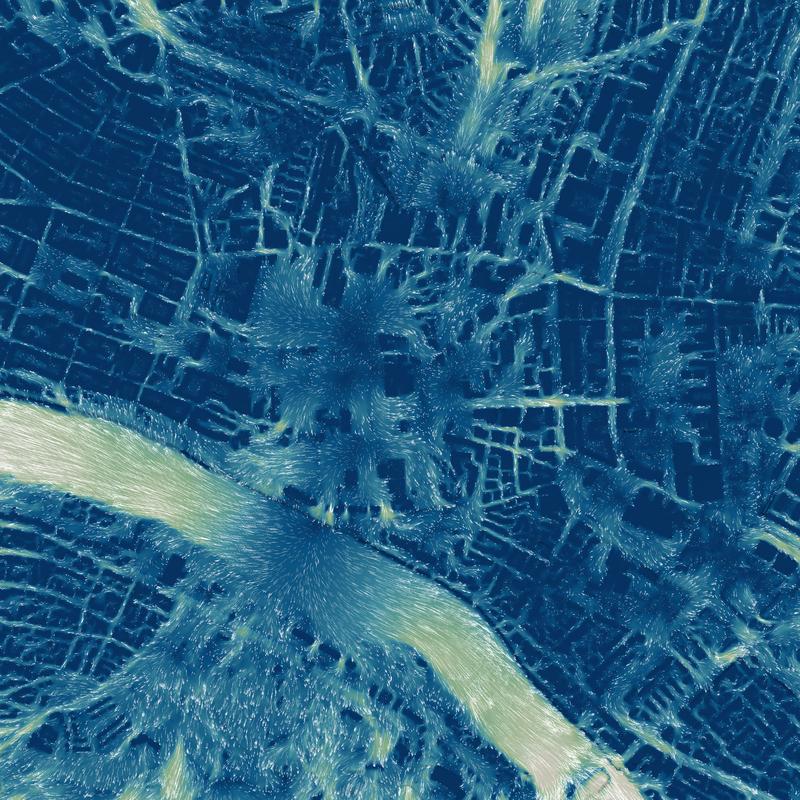
Cool air transport including vectors at pedestrian level
Cool air transport with overlayed velocity vectors at pedestrian level (1.5m above ground level) two hours after sunset.

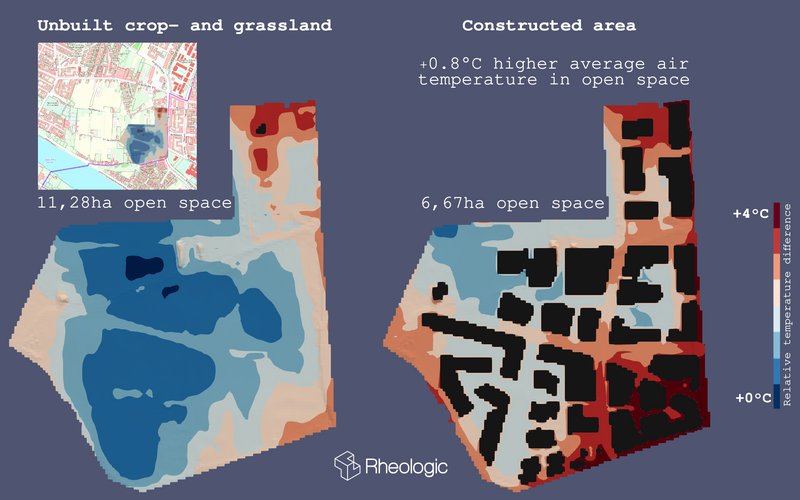
Projected differences in air temperature between unbuilt and built environment
Detailed A/B temperature analysis at pedestrian level (1.5m above ground level) in open space of unbuilt vs future built environment

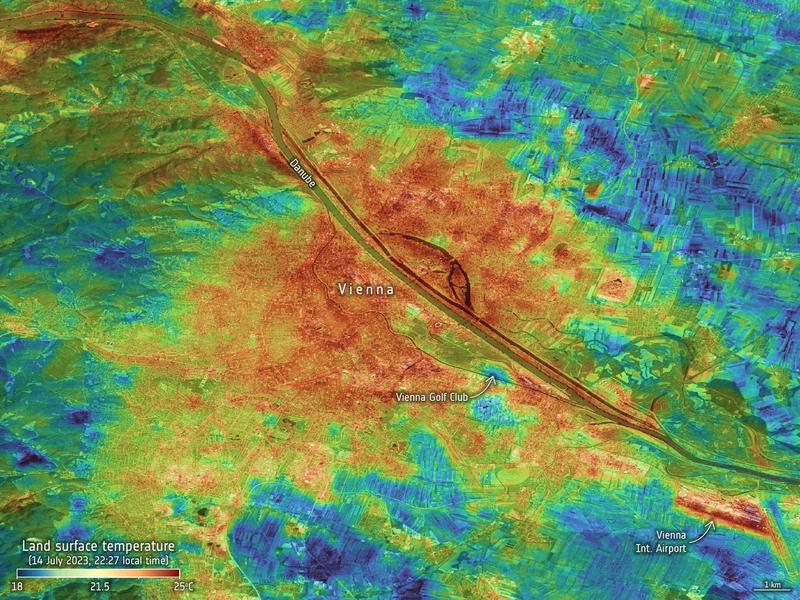
Comparison to IR surface temperature measurements
“Land surface temperatures around Vienna, Austria, on 14 July 2023 measured from space at 22:27 CEST. The temperatures were recorded by NASA’s Ecostress instrument which is carried on the International Space Station.
Hot surfaces are clear to see in bright red while the cooling effect of parks and vegetation can be seen in the image.
Measurements of the temperature of Earth’s surface taken from space are essential to track the impact of climate change, and to being better prepared for such extremes – especially when it comes to cities where stifling urban heat islands form.
Land surface temperatures across Austria can be explored via ESA’s Green Transition Information Factory – an online platform providing actionable information from Earth observation to accelerate the Green Transition for both society and the economy.
Users can also map and quantify the presence of green roofs on buildings – an effective measure in mitigating the impacts of urban heat islands owing to their significant cooling power. The platform provides valuable insights into their impact to mitigate the urban heat island effect as well as helping cities to plan further mitigation measures to prepare for extreme heatwaves in the future.”
(Cited from esa.int)

Conclusion
Night time cooling effects and local microclimate were modeled with high spatial resolution. Building level accuracy and strong agreement with experimental data and previously published literature was achieved. Results enable nature advocacies and city planers alike to quantify and evaluate impacts of building projects on night time cooling and cool air flows.
Attributions, data sources and licences
OpenFOAM licence: GPLv3. http://www.gnu.org/licenses/quick-guide-gplv3.html
Produced using Copernicus WorldDEM-30 © DLR e.V. 2010-2014 and © Airbus Defence and Space GmbH 2014-2018 provided under COPERNICUS by the European Union and ESA; all rights reserved.
The activities of Rheologic GmbH are not officially endorsed by the Provider, the Licensor or any other legal entities in charge of the Copernicus programme or the delivery of Copernicus data and information under the Copernicus programme.
Generated using Copernicus Climate Change Service information.
Using imagery ©2023 ESA; ©2023 NASA/JPL
Carver, Robert W, and Merose, Alex. (2023): ARCO-ERA5: An Analysis-Ready Cloud-Optimized Reanalysis Dataset. 22nd Conf. on AI for Env. Science, Denver, CO, Amer. Meteo. Soc, 4A.1, https://ams.confex.com/ams/103ANNUAL/meetingapp.cgi/Paper/415842
Hersbach, H., Bell, B., Berrisford, P., Hirahara, S., Horányi, A., Muñoz‐Sabater, J., Nicolas, J., Peubey, C., Radu, R., Schepers, D., Simmons, A., Soci, C., Abdalla, S., Abellan, X., Balsamo, G., Bechtold, P., Biavati, G., Bidlot, J., Bonavita, M., De Chiara, G., Dahlgren, P., Dee, D., Diamantakis, M., Dragani, R., Flemming, J., Forbes, R., Fuentes, M., Geer, A., Haimberger, L., Healy, S., Hogan, R.J., Hólm, E., Janisková, M., Keeley, S., Laloyaux, P., Lopez, P., Lupu, C., Radnoti, G., de Rosnay, P., Rozum, I., Vamborg, F., Villaume, S., Thépaut, J-N. (2017): Complete ERA5: Fifth generation of ECMWF atmospheric reanalyses of the global climate. Copernicus Climate Change Service (C3S) Data Store (CDS).
Hersbach et al, (2017) was downloaded from the Copernicus Climate Change Service (C3S) Climate Data Store. We thank C3S for allowing us to redistribute the data.
The results contain modified Copernicus Climate Change Service information 2022. Neither the European Commission nor ECMWF is responsible for any use that may be made of the Copernicus information or data it contains.
Using OpenStreetMap® open data, licensed under the Open Data Commons Open Database License (ODbL) by the OpenStreetMap Foundation (OSMF). https://www.openstreetmap.org/copyright
Stadtplan Wien licence: CC-BY-4.0 https://creativecommons.org/licenses/by/4.0/
Generated using ALS data provided by the Austrian Federal Office of Metrology and Surveying. Bundesamt für Eich- und Vermessungswesen (BEV, Austrian Federal Office of Metrology and Surveying) data licence: CC-BY-4.0 https://creativecommons.org/licenses/by/4.0/
Google satellite data imagery attribution. This work includes data from: - Google - Airbus, - Maxar Technologies - CNES / Airbus - Geoimage Austria - Data SIO, NOAA, U.S. Navy, NGA, GEBCO - TerraMetrics - Data LDEO-Columbia, NSF, NOAA, Imagery from the dates: 2004–2024
Recommended literature
[1] Wossenu Abtew and Assefa Melesse: Evaporation and Evapotranspiration - Measurements and Estimations. Springer, 2013.
[2] Farshid Aram, Ester Higueras Garcı́a, Ebrahim Solgi, and Soran Mansournia: Urban green space cooling effect in cities. Heliyon, 5(4):e01339, April 2019.
[3] Mairgareth A. Caird, James H. Richards, and Lisa A. Donovan: Nighttime stomatal conductance and transpiration in c3 and c4 plants. Plant Physiology, 143:4–10, 2007. Copyright 2007 American Society of Plant Biologists.
[4] Silvina Dayer, José Carlos Herrera, Zhanwu Dai, Régis Burlett, Laurent J. Lamarque, Sylvain Delzon, Giovanni Bortolami, Hervé Cochard, and Gregory A. Gambetta: Nighttime transpiration represents a negligible part of water loss and does not increase the risk of water stress in grapevine. Plant Cell Environ., 44:387–398, 2021.
[5] Martial Haeffelin, Jean-François Ribaud, Jonnathan Céspedes, Jean-Charles Dupont, Aude Lemonsu, Valéry Masson, Tim Nagel, and Simone Kotthaus: Impact of boundary layer stability on urban park cooling effect intensity. Atmospheric Chemistry and Physics, 24(24):14101–14122, December 2024.
[6] Cor Jacobsa, Lisette Kloka, Michael Brusec, João Cortesãod, Sanda Lenzholzerd, and Jeroen Klucka: Are urban water bodies really cooling? Urban Climate, 2020.
[7] Tomoki Kiyono, Takashi Asawa, Akira Hoyano, and Katsuya Shimizu: Weighing whole tree tran- spiration rate of urban trees and analysis of trees morpho-physiological effects. In ICUC9 - 9th International Conference on Urban Climate jointly with 12 th Symposium on the Urban Environment.
[8] Esmaiel Malek: Night-time evapotranspiration vs. daytime and 24 hour evapotranspiration. Journal Of Hydrology, 138:119–129, 1991.
[9] Sam Miller: Applied Thermodynamics For Meteorologists. Cambridge University Press, 2015.
[10] Viliam Novák: Evapotranspiration in the Soil-Plant-Atmosphere-System. Springer, 2012.
[11] Klaus Reichardt and Luı́s Carlos Timm: Soil, Plant and Atmosphere. Springer, 2020.
[12] Jonas Schwaab, Ronny Meier, Gianluca Mussetti, Sonia Seneviratne, Christine Bürgi, and Edouard L. Davin: The role of urban trees in reducing land surface temperatures in european cities. Nature communications, 2021.
[13] Rachel A. Spronken-Smith: Energetics and Cooling in Urban Parks. PhD thesis, The University of British Columbia, 1994.
[14] G. Sun, J.-C. Domec, and D.M. Amatya. chapter Forest Evapotranspiration: Measurement and Modelling at Multiple Scales, pages 32–50. This chapter is in the public domain. Forest Hydrology: Processes, Management and Assessment (eds D.M. Amatya, T.M. Williams, L. Bren and C. de Jong).
[15] Y. Toparlar, B. Blocken, B. Maiheu, and G. J. F. van Heijst: The effect of an urban park on the microclimate in its vicinity: a case study for antwerp, belgium. International Journal of Climatology, 38(S1), December 2017.
[16] Y. Toparlar, B. Blocken, B. Maiheu, and G. J. F. van Heijst: A review on the CFD analysis of urban microclimate. Renewable and Sustainable Energy Reviews, 80:1613–1640, 2017.
[17] Yuting Yang: Evapotranspiration Over Heterogeneous Vegetated Surfaces. Springer, 2015.
[18] Yohannes Yihdego and John A. Webb: Comparison of evaporation rate on open water bodies: energy balance estimate versus measured pan. Journal of Water and Climate Change, 9(1), 2018.
Published: