Good DEEDS for climate change

What is DEEDS? A global standard definition of the diurnal temperature, humidity and other important parameters for heat wave days.
Why do we need it? Adapting to climate change, especially in urban centers requires robust and standardized data for mitigation measures to be built upon.
What does that mean in practice? If you simulate urban heat island effects for heat waves, you will want to know - for example - how the temperature changes throughout the day. DEEDS defines a global standard for how to derive such numbers in any city in the world.
We are defining DEEDS - the Diurnal Extreme Heat Day Standard - as a globally applicable method to describe the typical heatwave day using intra-day (diurnal) values. Our definition yields a DEED (Diurnal Extreme Heat Day) as hourly values over a 24h period with air temperature, humidity, air velocity, etc. plus the average sun angles with a bias for recent climatic conditions in a particular location.
While there are many definitions for a heat wave1, there is no globally applicable and standardized definition of a average heatwave day nor for the diurnal change of meteorological parameters on such a day. However such a definition is helpful in the assessment of climate change adaption for cities. For example urban microclimate simulations, building simulation models and municipal functions that work on climate change mitigation (urban design, building codes & regulation, emergency services, power planning, …) need a way to describe a heatwave day in a particular location. DEEDS provides a standardized way to describe such a typical day in any location across the globe.
DEEDS allows us to answer questions like these: What is the typical wind velocity on a heatwave day in Berlin? What is the sun position during a heatwave day in Stockholm? When does the air temperature reach its maximum on a typical heat wave day in Rome? What is the humidity on a typical heatwave day in Los Angeles and how does it change during the day? How fast does it cool down after sundown on a typical heatwave day in Madrid? How hot does it feel at 9pm in the evening on a heatwave day in Istanbul? …
Goal of DEEDS
In our practical work of simulating microclimate for mitigation planning in cities we are often confronted with the question of how a typical day of extreme heat can be defined. Often we fall back to available measurements of single, hot days or semi-arbitrarily defined summer days or tropical nights and such, as they are often defined by local governmental weather services. There is however no commonly accepted way to do this globally or even regionally.
This means that different projects cannot refer to a common way to determine these numbers. For example if you simulate the energy balance of a building on a hot day in a particular location, it would be nice of you would know which urban centers have a similar characteristic, so that you don’t need to replicate your work.
It also makes communication much easier: there are usually a number of different topical experts involved in any given real estate development project; referring to a standard definition of a hot day helps everyone because it is immediately clear what people mean. Architects, public transport planners and energy engineers can refer to the same standard: “…in this project we are using the DEEDS definition for hot weather data…” (see below under Nomenclature for more fine-grained naming).
With DEEDS we address this by proposing a simple definition for a Diurnal Extreme heat Day that is:
- easy to calculate,
- does only require climate data that is readily available,
- has a bias towards current climatic conditions,
- is specific for the location and
- focuses on heat stress impact
DEEDS Definition
We define a DEED as the average value of air temperature, humidity, wind velocity and sun position of all heatwave days that occurred in a particular location 10 calender years prior to the calculation date. We define a heatwave day as a day where the average air temperature is greater or equal to the 97.5% quantile of this 10 year period and the day is part of a group of days where this is true on at least 3 consecutive days.
So a heat wave day \(D_{\textnormal{hw,Y}}\) for a given year \(Y\) is defined as:
\[D_{\textnormal{hw}, Y} = \bigcup_{Y-1}^{Y-11} \overline{T}_{i} \quad \textnormal{if} \quad \overline{T}_{i} \geq {\left.\overline{T_{97.5\%}}\right|_{Y-1}^{Y-11}} \quad \textnormal{and} \quad \{ D_{\textnormal{hw},i}, D_{\textnormal{hw},i+1}, \dots, D_{\textnormal{hw},n} \mid n \geq 3 \}\]with \(\overline{T_{i}}\) being the average temperature of the day \(i\) and \(\overline{T_{97.5\%}}\) the 97.5% quantile of the daily average temperature of the preceding 10 years. The DEED is then the diurnal arithmetic mean of the set of all heatwave days \(D_{\textnormal{hw}}\). In addition to the diurnal values we also calculate the average DEED solar date, as the mean date of all heatwave days (omitting the year of course, to find the in-year temporal average). This date can then be used to calculate solar azimuth and altitude angles for a DEED.
In simpler terms: we calculate the average temperature of the hottest 2.5% of days for the last 10 full calendar years in that particular location. We then take all days that are at or above that temperature, but only when they are part of a heatwave lasting at least 3 consecutive days. The DEED is then the arithmetic mean of these days in hourly frequency. In addition we calculate the average date on which the heatwave days occur, to know the average sun position during these occurrences. \(\)
Example DEEDS for selected locations
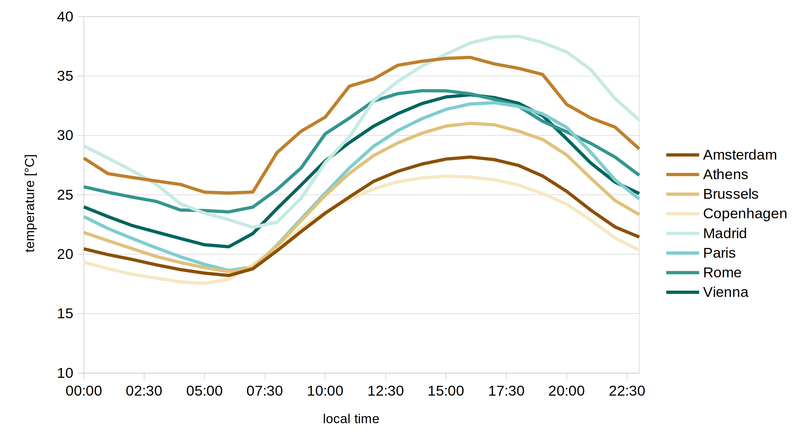
So how does this look like? The image below shows the DEEDS air temperature for selected European Cities. It is evident that there is quite some difference between these locations. While a typical heatwave day in Copenhagen for example, barely reaches a maximum air temperature of 26°C at 16:00, the maximum air temperature in Madrid goes beyond 38°C at 18:00 local time.

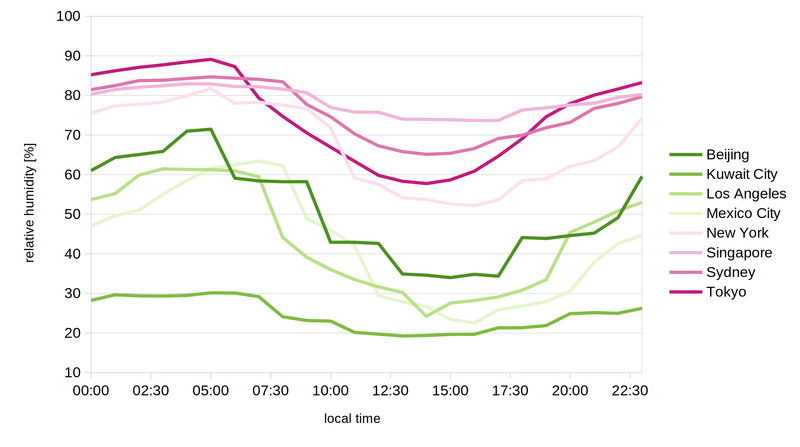
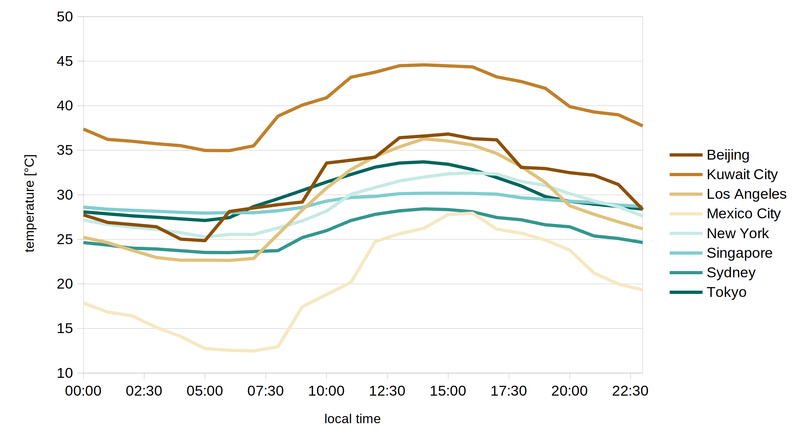
The spread is even greater naturally, when looking at some selected cities worldwide. Mexico City at relatively high altitude shows relatively low temperatures, especially in the early morning hours. Conversely during heatwaves in Kuwait City, the air temperature barely falls below 35°C at night. At the same time, while humidity in Kuwait City is very low on a typical heatwave day, it is rather high in cities like Tokyo and Singapore. These values allow a differentiated look at climate mitigation measures and allow planners to pick the right tools for each situation. For example in places with low humidity on heatwave days, sweating will be very effective, so communities should provide easy access to drinking water.

Rationale
DEEDS can work with minimal data requirements - in fact the underlying data are available globally on hourly basis2. Additionally it can also use data with higher spatial resolution, for example from a local weather station, if such data are available in sufficient quality. It can therefore be easily calculated for any desired location.
Hot weather and heat waves are linked to human health - various studies have shown that the best indicator of health effects of extremely hot days are the average daily temperatures (which include both nighttime and daytime temperature) over a duration of three days or more (see for example Impact of high temperatures on mortality: is there an added heat wave effect?) which is exactly the reason for us to adopt this for DEEDS.
The 97.5% percentile criterion for a location automatically considers the heat adaption for a location. What is considered to be extremely hot can vary considerably, not only in definition but also in the actual health effects although much less so for the latter due to heat adaption. What people call hot in Helsinki, Finland, is just Tuesday in Riyadh, Saudi Arabia, yet in both locations heat waves will impact health. In addition to physiological adaption, also local infrastructure and culture is indirectly included in this: how well are houses insulated, is air condition widely used, does social life permit breaks during the hottest hours etc. Human behavior and infrastructure is adjusted to local conditions hence we do not use hard cut-off temperatures3. A good breakdown and in depth analysis of this can be found in Weather-Related Mortality - How Heat, Cold, and Heat Waves Affect Mortality in the United States
For the same reason we are using air temperature as criterion rather than heat indices like Apparent Temperature or UTCI4: literature shows that air temperature is a better predictor than these physiological equivalent temperatures. While the reasons for this have not been researched in depth, we do suspect that it is due to the aforementioned behavioral and infrastructural differences. Heat indices do include solar radiation for example, but people tend to avoid the sun under these conditions and might even seek out places that are air conditioned specifically in these situations. Air temperature is a more robust predictor for health impact of heatwaves in the light of such behavior. Detailed statistics about mortality during heatwaves support this interpretation, compare for example: Defining Heatwaves with Respect to Human Biometeorology. The Case of Attica Region, Greece
Pre-Compiled DEEDS values for major urban centers
We will provide pre-compiled DEED values for major urban centers around the world. These will be regularly updated and are intended as an easy-access option for users that are interested in such data. We will publish a link to download the data here, as soon as we have compiled all the information.
Please note, that we cannot take any responsibility for any consequences that might arise from using this data.
Variants and Nomenclature
We purposely define DEEDS with flexibility in mind, so that it can be adjusted as needed in particular cases. In order to keep things well defined despite this, we propose a minimal convention on nomenclature, to avoid confusion and inconsistencies.
- Y - year
- Y-nn/p - year and period + time span
- % - quantil
- n - consecutive days
- T_max - max instead of mean temperature
Our standard DEED is defined for a period of 10 years, however it can be defined for other time spans and parameters for example in order to introduce more of a recency bias.
So for example \(D_{\textnormal{Y2009-Q2/5,%99,T_max}}\) would define a DEED with a period from Quarter 2 2004 to Quarter 2 2009 (5 years, inclusive) using the maximum daily air temperature instead of the mean and only the top 1% of all recorded temperatures instead of the top 2.5% defined in the Standard.
It is also possible to extrapolate DEEDS for future temperature developments. Some municipalities publish expected temperature changes due to climate change. For example the German Weather Service publishes near- and mid-term expected temperature anomalies. These can be used to project the diurnal DEEDS temperature into the future to represent expected heatwave temperatures in 20, 50 or 100 years - i.e. the typical life time of various urban planning projects.
Licensing
DEEDS can be used freely for non-commercial purposes and in any case for personal and research purposes, as long as you refer back to this page. This helps to promote a common definition (e.g. in case of updates) so that the standard may become adopted in this form.
In case you want to use DEEDS for commercial purposes, please get in contact - in most cases we will be able to grant a license fast and with minimal cost. If you use DEEDS as a commercial company, but not for commercial purposes, like for example showing it in presentations, referring to it as example etc., feel free to do so without asking extra permission. However, if DEEDS will become an integral part of what you offer, for example you want to use it in a software product, as part of a simulation service or integrate it in your commercial standard, we ask for a contribution so that we can keep this definition up to date and to provide pre-calculated and current numbers for common locations.
This work is licensed under a Creative Commons Attribution-NonCommercial-ShareAlike 4.0 International License. 
Anyone is of course free to follow our definition and to compute their own DEED values for a particular location and/or special variants of DEEDS with different parameters. In the latter case we do encourage you to follow the Nomenclature.
Get in Contact
If you have a comment about DEEDS, or you want to ask a question send us an email. Time and resources permitting we are also answering requests to calculate DEEDS for particular locations, please use this email link to request a DEED for a location and lets us know the location name, coordinates (lat, lon) and purpose of your request.
A comprehensive definition is given for example by Russo 2014 as Heat Wave Magnitude Index in Magnitude of extreme heat waves in present climate and their projection in a warming world and refined later in Russo 2015 Top ten European heatwaves since 1950 and their occurrence in the coming decades. As many of these definitions however, it is aimed to identify climatic deviations, so it also captures winter-heatwaves and defines a reference period of 1981 to 2010. ↩
For example ECWMF data are available globally in hourly frequency. ↩
Specifically for extremes and health effects we could resort to using heat indices or wet bulb temperature or similar characterizations, however the data needed for these values are not as widely available and we are not targeting physiologically extreme heat, but heatwaves that pose unusually hot conditions for the local population and therefore needs some kind of planning and management. ↩
In our article about heat indices we argue that these are better suited to judge thermal comfort and health than air temperature and we stand by this. We use Apparent Temperature and UTCI to assess places for their comfort/health impact and these indices are the best tool for that. However, these number do not say anything about human behavior under these circumstances, nor about any mitigating infrastructure that might be available to residents. Therefore the air temperature is a better prediction of the general health effects, while heat indices are the better tool for communication and planning. ↩
Published: