Temperature has feelings too!

In extreme climatic conditions - during summer and also winter - the weather report and authorities often refer to ‘felt’ temperature, wind chill temperature or similar to characterize extremely cold or extremely hot conditions. As subjective as ‘felt’ sounds, many of these temperatures are tied to human physiology and indicate the amount of climate stress a body is exposed to. In extreme cases, this impacts on health and even on survivability of certain conditions.
In this article we provide an overview, explain the most important of these temperature indices and explain why they become increasingly important for heat waves in urban conditions. The best suited factors to describe outdoor heat events are the AT - Apparent Temperature and the UTCI - Universal Thermal Climate Index, let’s find out why!
How subjective are feelings about temperature and what is the concern?
Feelings are generally considered as subjective, but with respect to environmental conditions the word ‘felt’ sounds deceptively inconsequential. This could not be further from the truth, because while accurately named, the feeling as in ‘felt temperature’ simple serves the purpose to keep us alive (akin to the feeling of pain). A better expression for ‘felt’ temperature is physiological-equivalent temperature or apparent temperature, because these numbers are a direct measure for the equivalent air temperature that our physical body has to deal with in order to keep working. Being exposed to extreme values of such temperatures means physiological stress for the body and over several hours results in death by freezing or heat stroke.

Historically apparent temperature was used first in the context of extremely cold weather and how much colder it feels if it is very windy. This is often referred to as wind chill factor. Despite this origin, apparent temperature indices are gaining increasing relevance for their usefulness to describe hot weather conditions, which we will concentrate on.
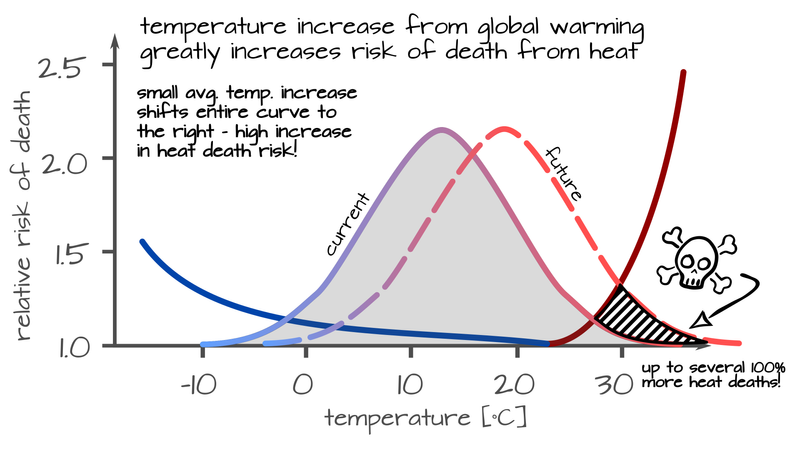
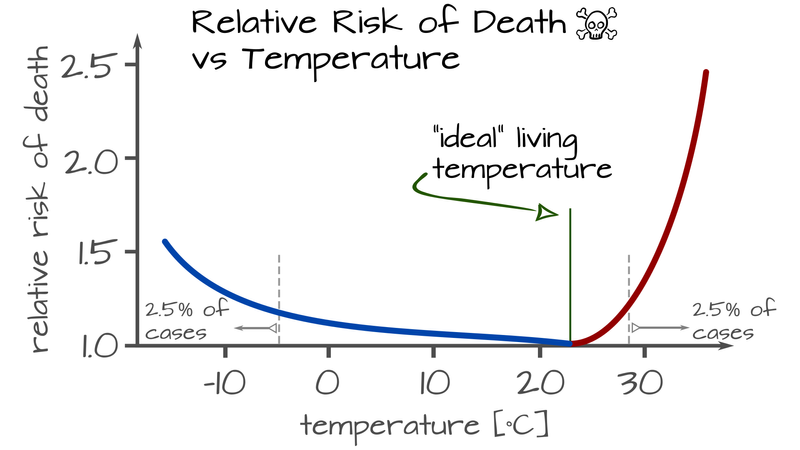
Relative Risk of Death vs Temperature The graphs shows that risk of death (and many more health issues) increases steeply with (air) temperature. The reason for that is the way human thermoregulation works. We will not go into as much detail as in our article about human thermoregulation, but let’s quickly summarize: in order to keep the human body working under hot conditions, sweating is by far the most effective mechanism.1 Evaporation of sweat needs to provide enough cooling to compensate heat input from hot air, physical activity and solar radiation and there are hard upper bounds for sweating respectively evaporation cooling.
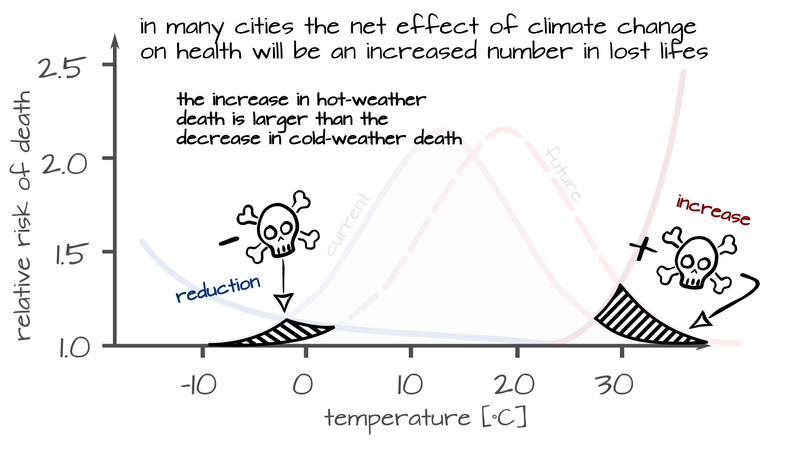
The graph above is a generic view that has been measured in similar form for many cities. Depending on local conditions (housing, heat adaption, climate zone etc) there is quite some variation among cities, but this is the general form it takes. Cold related deaths (all below the ‘ideal’ temperature) are much more prevalent than hot related deaths. With increasingly warm climate ‘cold deaths’ will decrease and ‘hot deaths’ increase. Various scenarios show that the net effect will be an increase in overall temperature-related death in many cities around the globe.2
Aside from polar expeditions and mountaineers, few people are exposed to extremely cold and windy conditions and if they are, it is relatively easy to compensate by just adding insulation. It’s much more challenging to deal with very hot conditions as the graph above shows: the risk of death rises much quicker for temperatures above the ideal value, than for lower temperatures. To say it succinctly: you can alway put on more clothes, but you cannot always just sweat more.3
The main function of felt temperature indices is to describe these conditions in terms of a feels like (air) temperature, that is relatable and conveighs a sense of warning for the extreme ranges.
Let’s quickly go over the influence factors that are important for apparent temperature indices in addition to the air temperature:
Solar Radiation: Sunlight - including reflected light - transfers energy directly into the body. Just moving from the sun into the shadow will lower the perceived temperature even if no other conditions change. For a resting person, solar radiation can be the single largest influence factor on apparent temperature.
Activity: Physical activity can be the biggest source of heat the human body needs to manage. Very high activity, like intense sport, can generate about three times more energy in a body than direct solar radiation. Physical activity under hot conditions cannot always be avoided, many public services from police over garbage collection to construction work must be done in the open and during daylight.
Humidity: A high amount of water in the air inhibits our ability to sweat and renders our biggest cooling mechanism ineffective. If the air is fully water-saturated, no evaporation can occur and therefore also no cooling by sweating.
Air velocity: Air velocity has a big influence on evaporation cooling from sweating. In most cases, sweating is greatly enhanced when air moves faster. The apparent temperature drops, when sitting in front of a fan, even if the air temperature or any other conditions remain equal. Hence the traditional use of hand fans in many hot regions across the world.
The most commonly used hot temperature indices

Authorities, weather forecasting services, emergency planning, workplace safety, urban planning, architecture and landscaping are all using various variations of heat indices. We’ll briefly explain them and assess how well suited they are to describe outdoor hot climate. All the indices below (can) include the effects of air temperature, air velocity, solar radiation and humidity, however there are considerable differences in each particular approach.
AT - Apparent Temperature
AT is an relatively old, but robust heat index, primarily intended for weather forecasting and it is the official Australian standard for hot weather warnings reported in the form of a Heat Index Temperature. It also used in assessing health effects of heat waves in cities - for example in the large European PHEWE project (Assessment and Prevention of Acute Health Effects of Weather Conditions in Europe). The model is specifically designed for the use as hot climate weather forecasting and assumes that persons are clothed appropriately for the temperature and are moderately active outdoors (light work like walking). It is a pretty robust index that delivers good results over a variety of conditions and is relatively easy to calculate. The AT says:
“If you walk around outdoors today in this particular spot, you will feel as if the air temperature was X °C.”
PET - Physiological Equivalent Temperature
PET is a bottom-up model, that starts by modelling all energy flows on the human body in quite some detail, down to details of clothing for example, and then calculates the equivalent room temperature of a hypothetical room. The conditions for this are: almost no air flow, office clothing, male person with 75kg doing light office work. Despite this definition, PET is also frequently used for outdoor climate calculations. When seeing PET temperatures for outdoors, one has to be aware however, of this reference scenario. Depending on your use case this might not be the best option to characterize outdoor climate, especially for hot temperatures. (Who would not just take their jacket off, if it has 50°C in the office?) The PET says:
“If you go outdoors today to this particular spot, you will feel as if the air temperature was X °C while you are sitting fully clothed in an office, with little air movement doing light office work.”
UTCI - Universal Thermal Climate Index
The UTCI is - as the name says - a more universal derivative of the PET. Different to the PET and similar to AT, the UTCI automatically includes the effect of people adjusting their clothing style to the temperature. It also defines walking outdoors as physical level of activity with appropriate and realistic reference wind condition. It yields similar qualitative results as the AT. The UTCI says:
“If you walk around outdoors today in this particular spot at a velocity of 4km/h and a wind velocity of 1.15m/s, you will feel as if the air temperature was X °C.”
WBT and WBGT - Wet Bulb and Wet Bulb Globe Temperature
These two methods follow a more physically ‘extreme’ approach. Wet Bulb means, that the air temperature is measured while the thermometer is wrapped in a wet cloth. Water evaporating from the cloth cools down the thermometer as much as the air humidity permits, to the lowest possible temperature that can be reached by evaporation (aka sweating). The Wet Bulb Globe Temperature additionally includes effects of radiation and dry air temperature. Both measures do not describe an equivalent temperature, so they cannot be interpreted intuitively. In practice that means that being exposed to a WBT temperature of approximately 32-35°C for more than a couple of hours is deadly even for healthy persons resting in the shade with unlimited water supply. WBGT is used by the military, in sports and workplace medicine to characterize extremely hot conditions. The WBT and WBGT says:
“If you walk around outdoors today in this particular spot and the WBGT temperature approaches 32°C, you can only be physically active for a very short time. You will die if you cannot reach a place with cooler conditions within 1-2 hours.”
PMV - Predicted Mean Vote
PMV was created as a measure of how comfortable people would usually rate certain climatic conditions on average. Statistics and some deductions then allow the opposite prediction: how satisfied will most people be with a certain combination of air temperature, humidity, radiation and air velocity. The measure if often used for indoor climate assessment. Its opposite is the PPD - the Predicted Percentage of Dissatisfied. The PMV says:
“If there are 100 persons around outdoors today in this particular spot, X % of persons will be satisfied with the conditions.”
There are a number of variations of these heat indices and some additional methods that we did not mention, all of them with their particular strengths and weaknesses.
So which is the best index?

As always in science and engineering: it depends. For the purpose of simulating urban heat island effects and providing an intuitive measure of how a certain place with its combination of air temperature, velocity, solar radiation (reflection) and humidity will feel, the AT - Apparent Temperature and UTCI - Universal Thermal Climate Index are suited best. In our simulations we usually show at least one of these factors and sometimes both. This allows us a fine-grained assessment of development projects down to the meter, so that we can optimize conditions for the intended use of an area (commercial, sport, sitting, waiting, recreation, …). Whichever index you prefer - one thing is sure: the importance of assessing climate change and to create urban landscapes that are well-suited to increasing temperatures is only going to become bigger!
If you want to see some examples of our work, have a look at our project page! If you are interested to work with us, send us an email and let us know!
A grain of salt: The graphs above are just hand drawn illustrations of the situation. While they do show the general form of the real graphs, we took some liberties to simplify things. For example you cannot really find the integral of less/more deaths like we depict it, but we ran with it because it is a good visual analogy of what’s actually happening. If you want to learn more, we encourage you to have a look at the scientific literature in the field, much of which is freely available. Good places to start are the following publications: Mortality risk attributable to high and low ambient temperature: a multicountry observational study, Projections of temperature-related excess mortality under climate change scenarios or Heat Effects on Mortality in 15 European Cities.
Humans have evolved for persistence hunting and are very good at keeping an even body temperature even under physical activity in hot weather. The largely hairless body allows for fast evaporation of sweat. Walking upright and head hair minimizes the heat impact of solar radiation and keeps the breathing rhythm independent of the gait. See our articles about desert survival strategies and human thermoregulation for details. ↩
see Projections of temperature-related excess mortality under climate change scenarios, http://dx.doi.org/10.1016/S2542-5196(17)30156-0 ↩
Technical solutions like cooling jackets are emerging for persons that are especially exposed and must be active in extreme heat (emergency construction, police, military, …), however these are neither a long-term solution nor suitable for casual use. It’s likely that with increasingly hot temperatures there will be regions on earth were humans can only survive for short periods of time (hours) without artificial cooling. ↩
Published: