Green Pergola Microclimate

For the project GZS²1, funded by the klima + energie fonds2, we have already published a public access paper with details about the measurements and simulations that were done during the course of this project.
The goal was to follow up on a previous, much bigger project with measurements and simulation to determine the impact of green wall and green pergola installations in and around two schools in Vienna Austria. In this short article we are explaining some of the effects that can been seen in the simulations - and are confirmed by the measurements - and draw some general conclusions about how to maximize the effectiveness of such smaller scale green infrastructure. Despite the small size, they can create pleasant little oases on accessible roofs, large balconies and similar urban spaces.
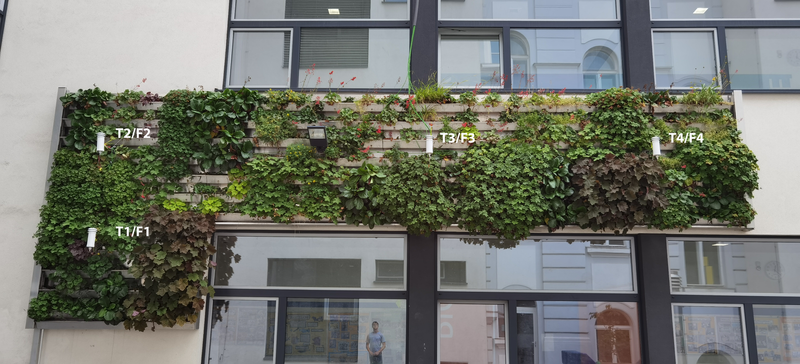
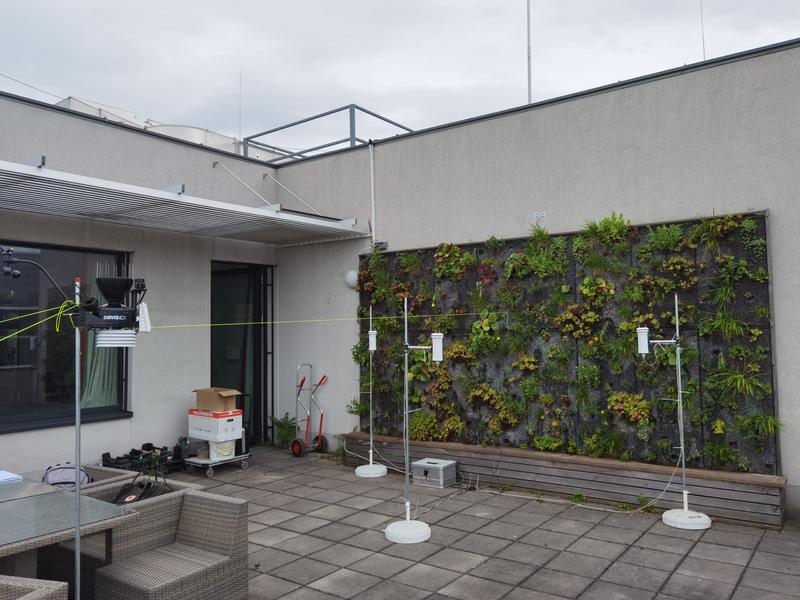
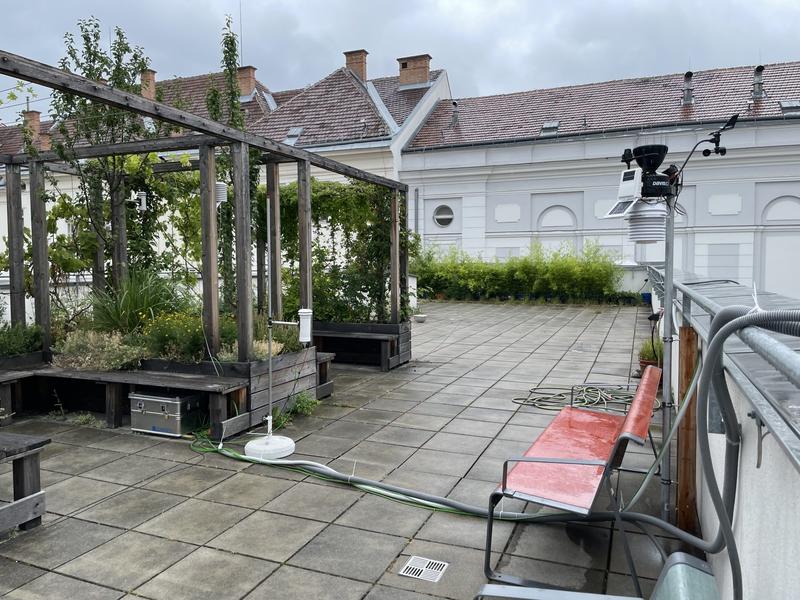
For the simulation part of the projects we looked into two different schools where some green infrastructure was installed. At School A (Diefenbachgasse), a small, green wall was installed on a terrace and at School B (Schuhmeierplatz), there was a green pergola installed on a terrace and additionally a green wall in the courtyard .
For the green walls, there was little to no measurable change in air temperature observed in the vicinity (except between the leaves inside the green wall) and the same results were obtained independently in the simulation. The input parameters for the simulation were the change of air temperature over 24 hours at the inlet of the simulation domain, the angle and intensity of solar radiation and the approximate water consumption of the installed green infrastructure as well as initial wall temperatures, heat capacities and albedo of various surfaces.
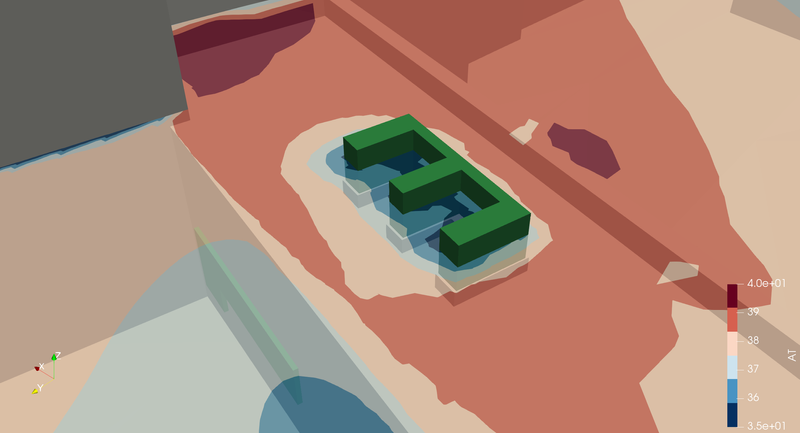
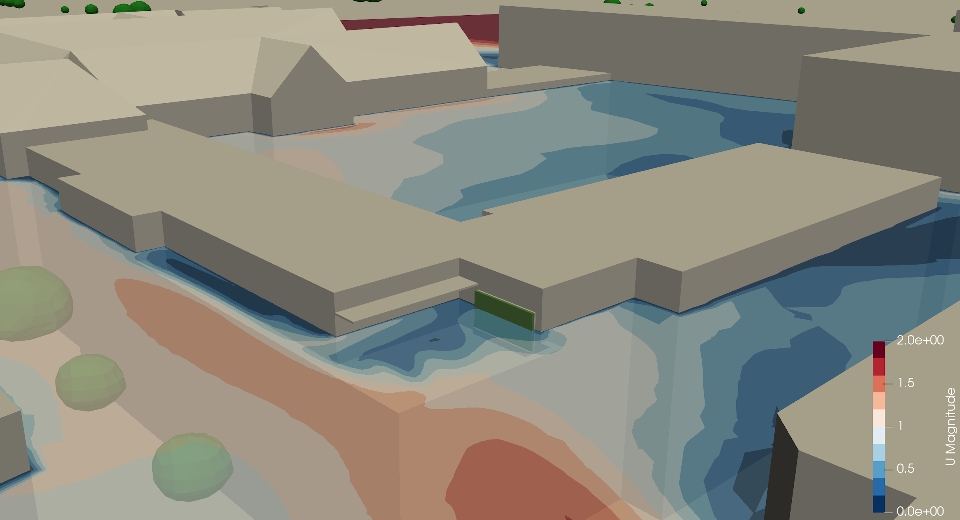
The images below show the wind velocity, respectively air temperature around the green wall at School A. Note that the air velocity around the green wall is higher than the air velocity around the perpendicular wall to the left on the side of the building. This wall is in the shadow and relatively cool. The slower air movement around the wall in the lee of the building gives the air more time to take on the temperature of the wall, whereas the opposite is true where the air is moving slightly faster around the green wall.
Additionally the terrace right in front of the green wall and the green wall itself are directly impacted by solar radiation at this point in time (15:00 local time). The combination of these factors results in lower air temperatures in the immediate vicinity of the bare wall than at the green wall.
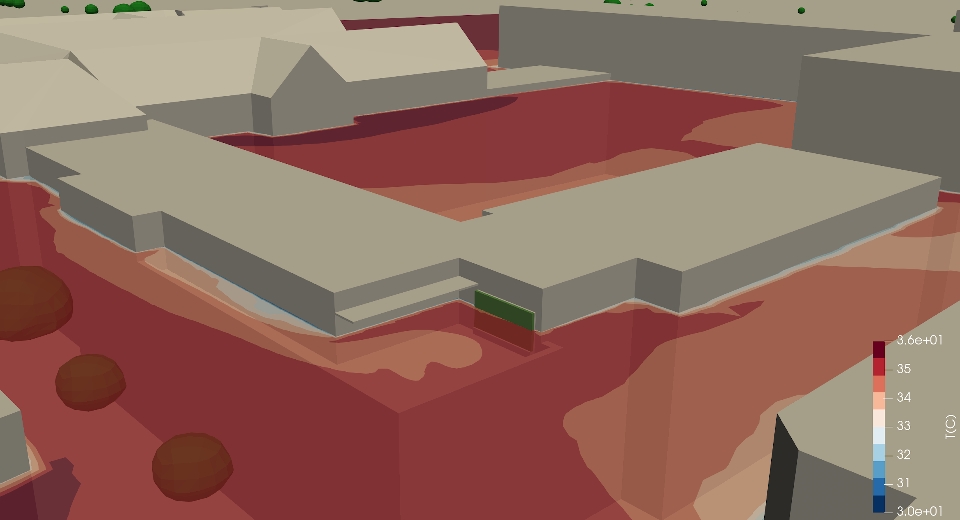
This shows again that the complex interactions between surface temperature, urban geometry, wind velocity, buoyancy and air temperature can quickly shift depending on which factor dominates at a certain point in time. In this instance, it is the combination of the bare wall being in the shadow and having slow air flow around it, while the green wall is in the sun and has faster moving air around it. When planning for urban microclimate at this scale it is therefore paramount to consider all these factors with equal accuracy. Surfaces that are not accurately represented, wind flow that does not represent actual conditions at the site, omission of the influence of buoyancy etc. can quickly result in faulty assessments for these complex interactions in the urban canopy layer.
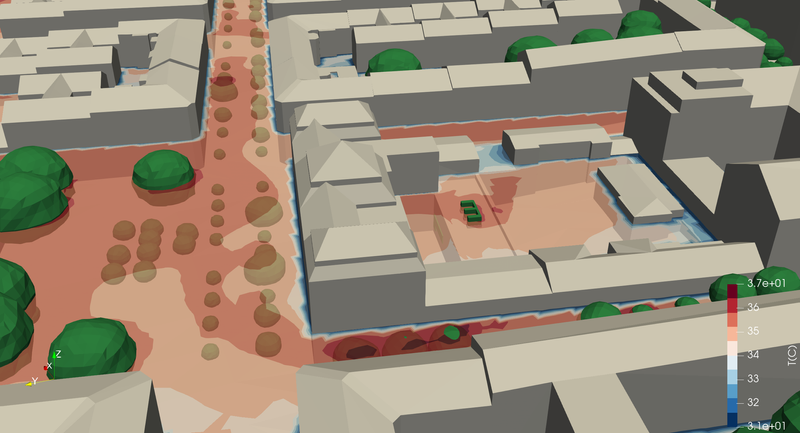
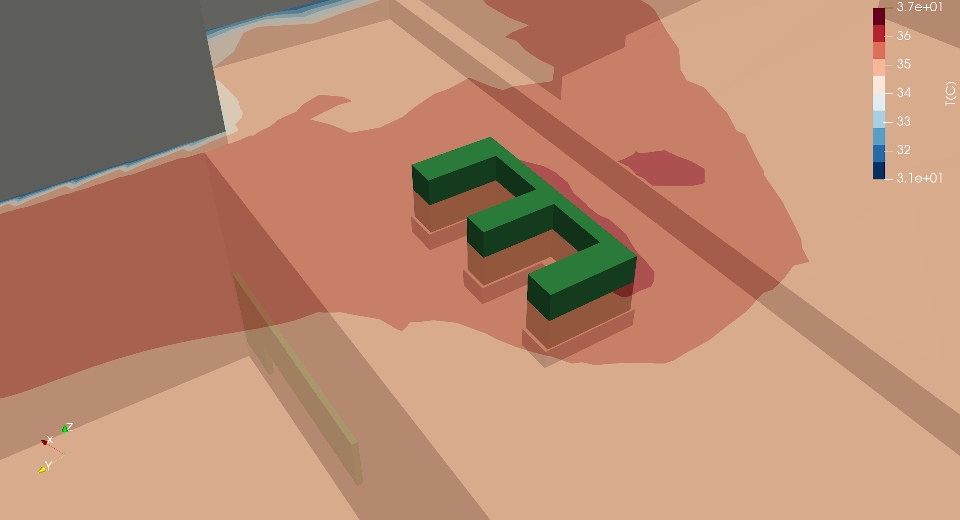
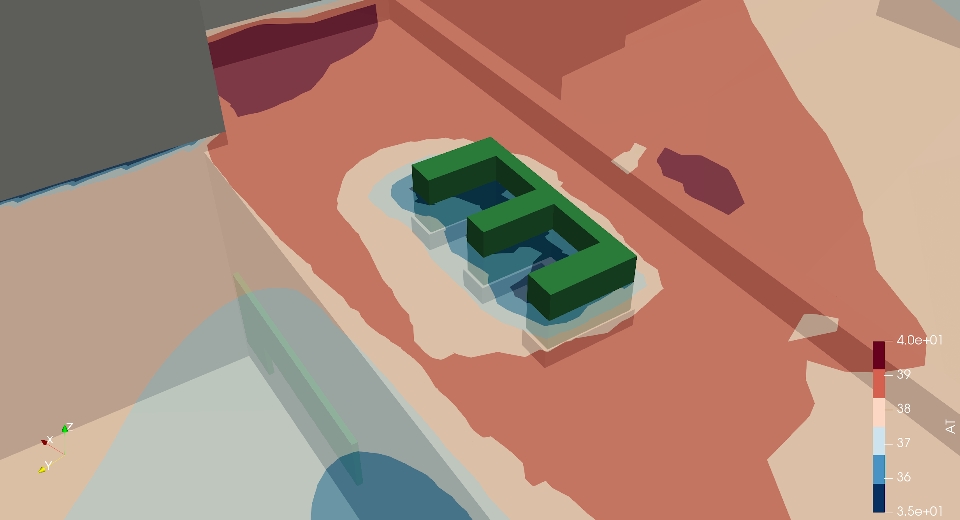
Let’s take a look at School B, where a green pergola was set up for students to use in breaks. Again we see the effect of the air temperature taking on the temperature of the surface - in this instance the warmer surface temperature of the roof that is directly exposed to the sun. The pergola is a flow obstacle (it is modelled as a porous medium, that permits some air flow but at reduced velocity) and therefore allows the air to take on more of the (warmer) temperature of its surroundings, causing a slight increase in air temperature.3 However, the green pergola also blocks a fair amount of sunlight and direct solar radiation is a mayor influence factor on the apparent (felt) temperature that we show in the second image. This shading effect is a lot bigger at 15:00 for the location than the small increase in air temperature, so that the net effect is a cooler, perceived temperature in the vicinity of the pergola despite the slight increase in air temperature.
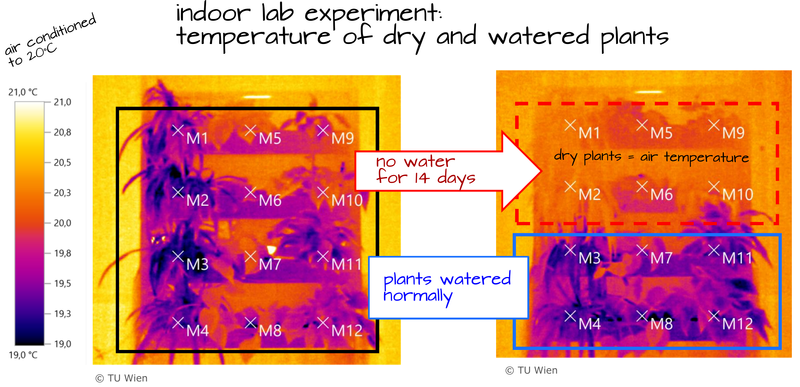
Another interesting outcome from the project comes from a control experiment done by the Vienna University of Technology: to assess the influence of the water availability on the surface temperature of used plants, a small laboratory experiment was set up. The room was held at a constant air temperature of 20°C and no direct sunlight was falling on the plants. After a initial period of calibrating the plants to a balanced amount of water consumption, the plants in the upper part of the green wall installment were left without water for 14 days. As the image clearly shows, this causes the plants to take on the air temperature whereas the watered plant show a surface temperature slightly below the air temperature in the room. Despite the small temperature differences the influence of the latent heat transfer during evapotranspiration of water from the leaf surface results in a very clear picture: plants without water do not show any lower surface temperature. While this measurement was done in a controlled setting, we are seeing the same effect when measuring green, impervious and pervious surfaces with/without water in direct sunlight and in the shade in the city.

The takeaway from this project is a confirmation of our claims in previous articles published on our website: microclimate simulation can predict perceived and actual air temperatures with a high level of confidence; shade is usually the largest influence factor for lowering the apparent temperature in the urban environment during daytime and the availability of water is a necessary condition for green infrastructure to show the desired effect of improving the urban microclimate.
If you are interested to work with us - either for research or development projects - just send us an email and let us know!
This project was funded by the klima + energie fonds as part of the Smart Cities Initiative. Lead project partner was the Vienna University of Technology, the microclimate simulations were done by Rheologic.
Some information about the project can also be found on the following pages in german language: Smart Cities Initiative - Green School Oasis and GrünStattGrau - GrüneZukunftSchulen²
GRÜNEzukunftSCHULEN² (green future schools 2) ↩
climate + energy fund is a project of the Austrian Ministry of Climate Protection, Environment, Energy, Mobility, Innovation and Technology ↩
The same effect occurs at night, when vegetation slows down movement of air and may hinder a more effective cooling of impervious urban surfaces. ↩
Published: