Microclimate Naschmarkt Vienna
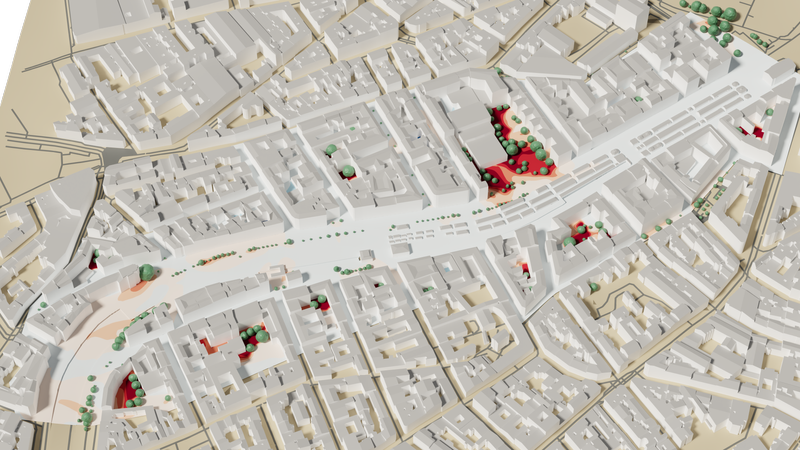
The Naschmarkt area in Vienna, a renowned tourist attraction, is currently undergoing a public re-design process. The City started a participative planning process that allows citizens as well as urban planners and architects to contribute their ideas. Since the area is close to our office, and even though we are not directly involved in the process, we wanted to contribute to the climate resilience of the design by publishing a simplified microclimate model of the current state.

Our model supports planners to find optimal, climate-adapted designs and likewise allows citizens and other stakeholder a full inside view into the possibilities of modern urban planning via our online 3D model, so that they can assess consequences of planning variants.
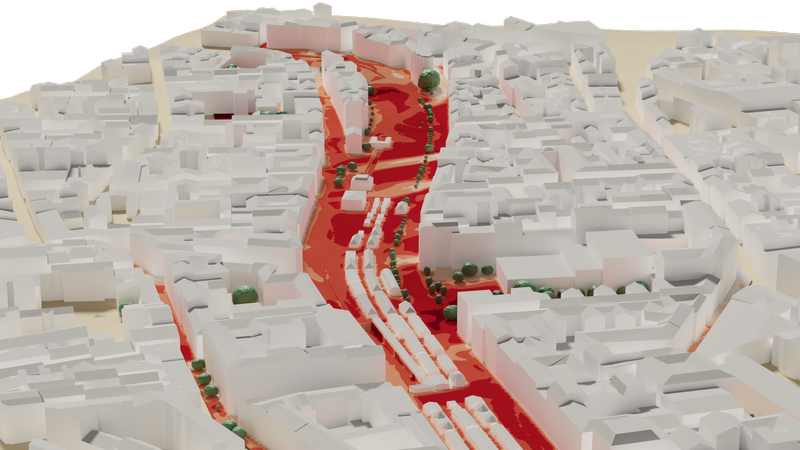
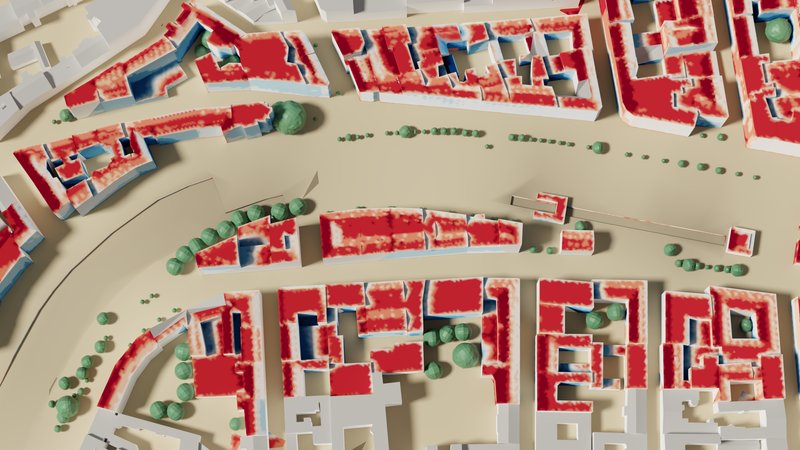
The model shows a hot summer day in Vienna, with a thermodynamic air temperature of up to 34°C and mostly clear skies at 15:001, the hottest time of the day. Inlet wind velocity and direction were computed from long-term statistical data to use values that are typical for a summer day in the area. Apart from air temperature, our model includes effects of solar radiation and reflection, shadows, humidity, evaporative cooling and wind velocity in high spatial resolution.


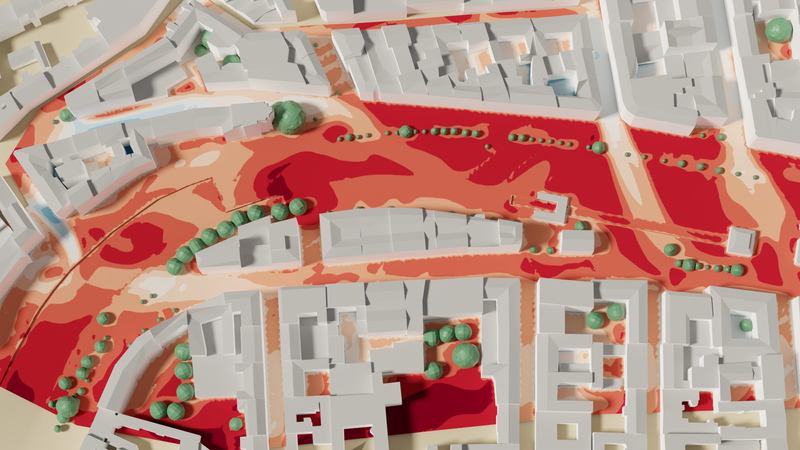
All these properties factor into the felt temperature (apparent temperature). This considers, for example, if a certain space is in the sun or in the shade, enjoys a cooling breeze or feels especially stifling due to high humidity. More information about these can be found in our article about human thermoregulation (English).

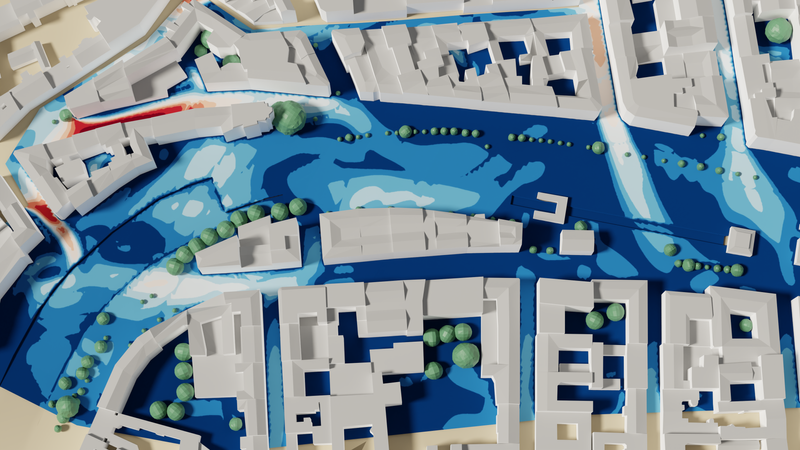
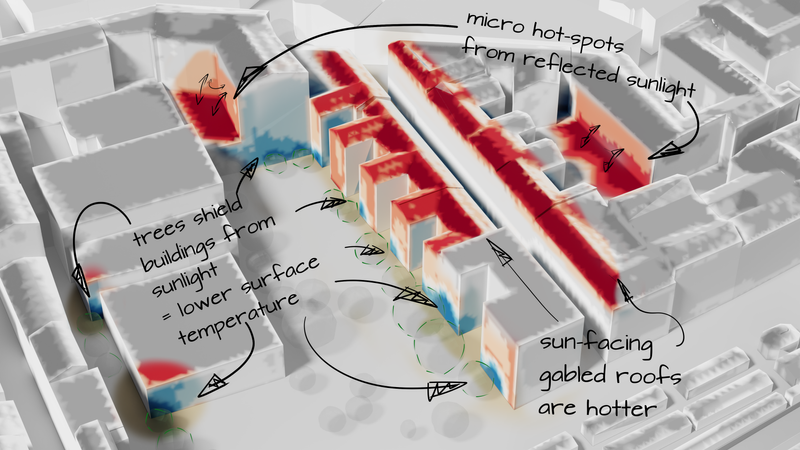
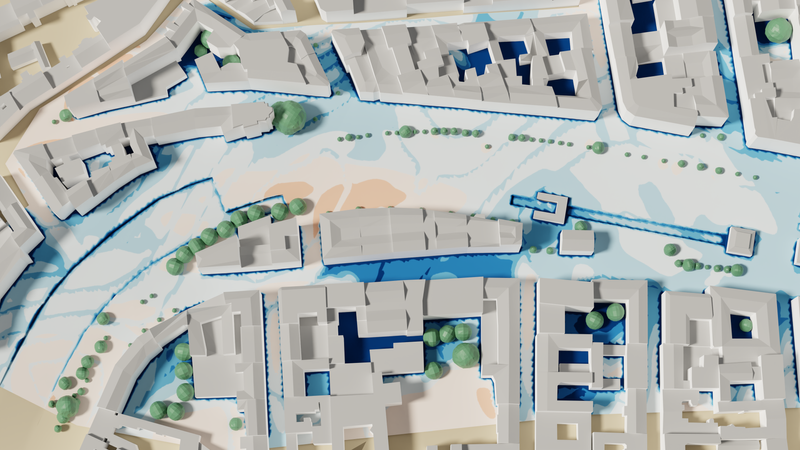
The type and surface properties of buildings also factor into the model, as well as the influence of trees on wind velocity and the cooling by evapotranspiration. Different to projects we are fully involved with, we have omitted additional analysis and improvements, which is why things like wind comfort, additional wind directions, greening variants, etc. are not included in this case. Our project page about microclimate aspern Seestadt goes into more detail and shows a before/after comparison of some design variants.
Even so, there are a number of lessons to be learned here: for example, how sojourn quality is lower in areas with low air movement and high solar radiation, how tree shadows influence surface temperatures and where humidity accumulates. Conclusions such as these, and insights into the physics that influence them, can be used by urban landscaping and architects to efficiently optimize the re-design for the challenges that climate change poses for cities. We are certainly looking forward to the designs coming out of the cooperative process!
The interactive 3D model of the simulation can be explored directly in the web browser. Besides additional simulation data, the model also contains the color legends for the data.
DISCLAIMER
The results of the microclimate simulation for the Naschmarkt area in Vienna were produced on sole initiative of Rheologic from (mostly) publicly available data2, at Rheologic’s own expense without any prior consultation with public authorities or other enterprises. We hope that our model is helpful, but do not accept any liability from third parties using or not using the information we have published here. The re-design of the area is led by the city of Vienna in the form of a cooperative process (link to official website). The information shown here has no connection to that process whatsoever.
While the model shows the situation at 15:00, the hottest time of the day, we do in fact calculate the evolution of all parameters over 24 hours. This allows us not only to assess projects at various times during the day, but also to optimize urban night time cooling. ↩
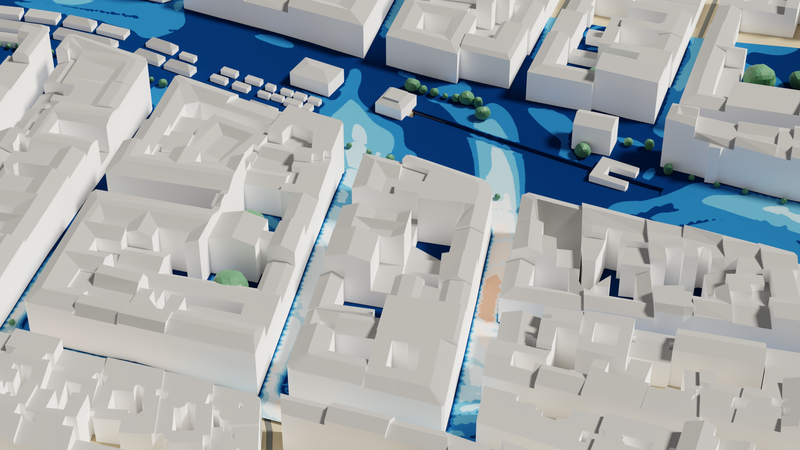
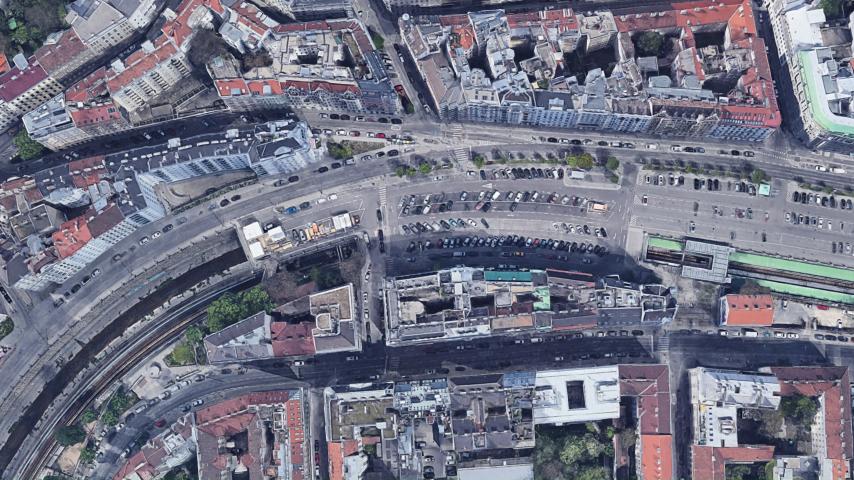
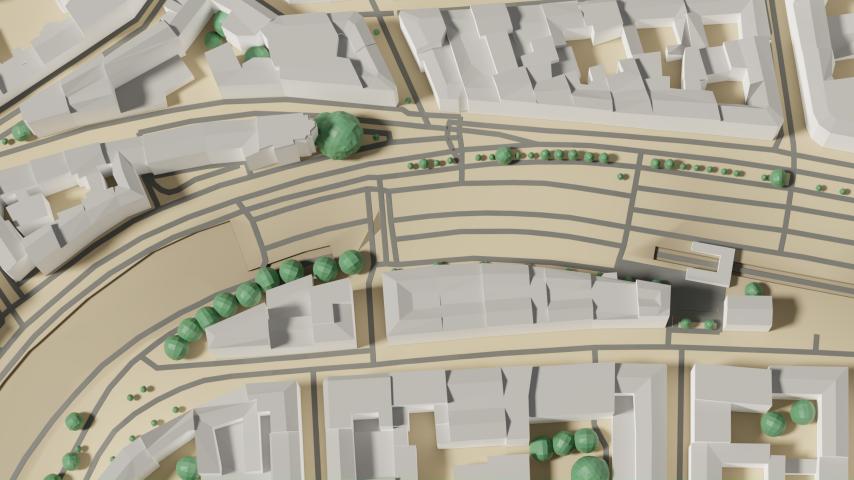
This entails that buildings are not included in full detail - even though the simulation is of very high resolution, there are inaccuracies in the model due to simplifications of buildings - see also the image comparison above. ↩
Published: