Hot summer winds and why some have names...
You may have heard of the Sirocco or Terral, both warm winds occurring under particular meteorological conditions and blowing from particular directions. While these two are specific for Southern Europe, it is not uncommon for heatwave wind to come from particular directions or occurring under particular conditions. In this article we are looking at heatwave wind and why it is important to take a differentiated look at wind for urban planning and real estate projects to mitigate urban heat island effects.
As an example we are looking at the wind in the City of Vienna, in continental Europe. While the people in Vienna do not have distinct names for prevailing winds, that does not mean that they don’t exist, as we will show.

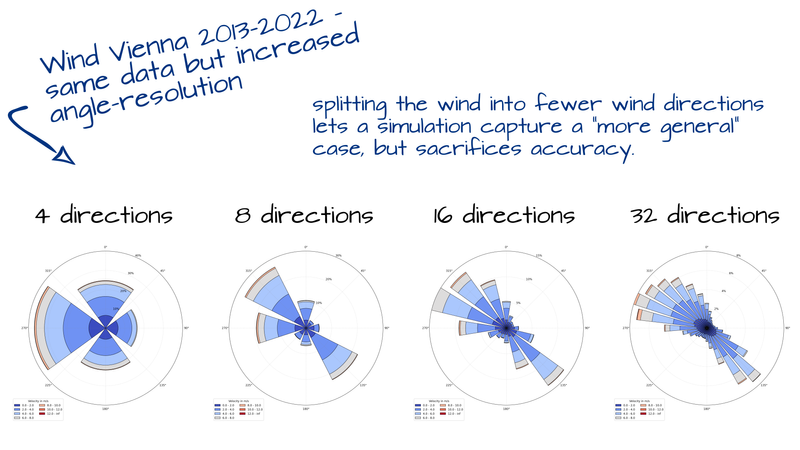
First things first: we are looking at wind through the lens of urban planning where wind directions, velocity and temperatures are important as input parameters for simulations that allow architects to plan comfortable outdoor areas (not too windy, not too hot). In order to do that we are using wind roses like the ones shown above. Commonly wind directions are divided into 4, 8, 16 or 32 directions.
Which of these resolutions are used in practice depends on a number of factors - amongst others on the computational intensity of the simulation - for relatively lightweight wind comfort and wind danger simulations, 16 directions can be used and then combined into an an average all-year factor. However for microclimate simulations, it’s better to focus on the most impactful conditions. In many cases these are summer conditions respectively hot weather.

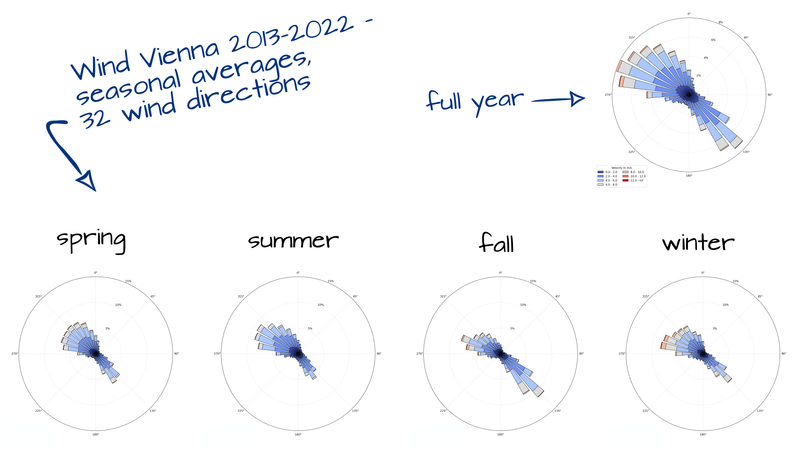
The image above shows the seasonal breakdown, it is apparent that seasonal wind changes quite a bit, not only in direction but also in velocity. In this case we see that for example winter wind has much higher wind velocity than the other seasons and fall wind tends to come more often from the southeast than the hotter summer wind. …or so it seems.

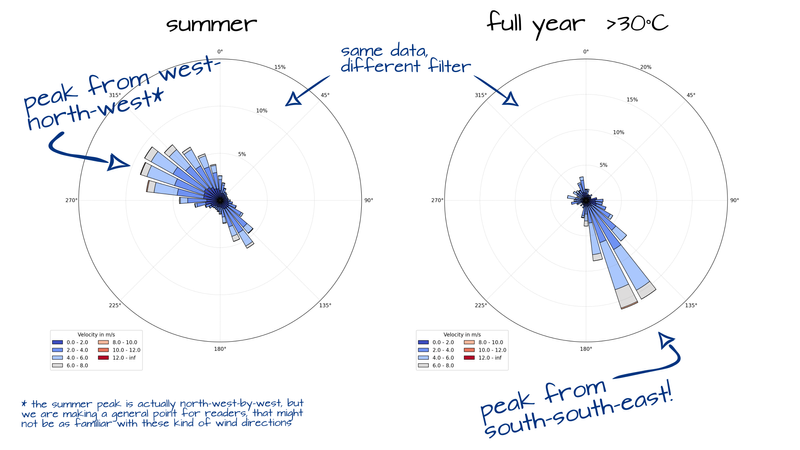
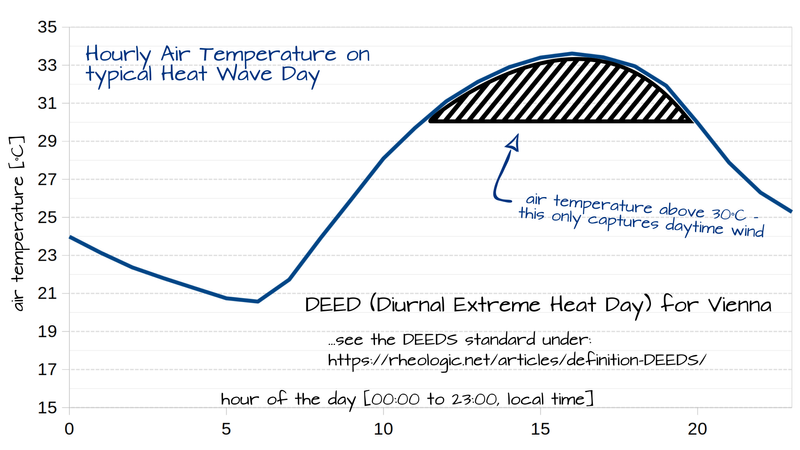
The image above shows that summer wind does not necessarily capture high-temperature wind. The two wind roses show summer (left side) and the average wind occurring during hours where the air temperature is above 30°C1. It seems apparent that ‘hot’ wind is distinctly different from ‘summer’ wind. But let’s take a closer look if that is really the the full picture.

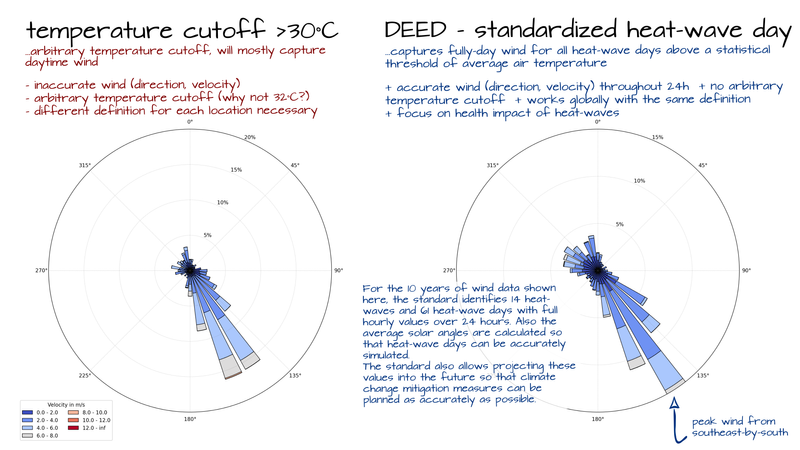
After all, as the image above shows, when we are introducing a simple temperature cutoff we are only looking at parts of the day when the temperature is very high - in the case we are only looking at wind from around noon to early evening. However as we explain in our article about DEEDS, the main health impact from hot weather (and this is ultimately what we’d like to look at in microclimate simulations) does not come from short periods of high air temperature but from prolonged periods of high average air temperature. It is much harder for the human organism to deal with heatwaves - including night time heat - than with short bursts of higher air temperature. So ideally we’d like to capture wind during heatwaves and not simply during hot hours in the summer.
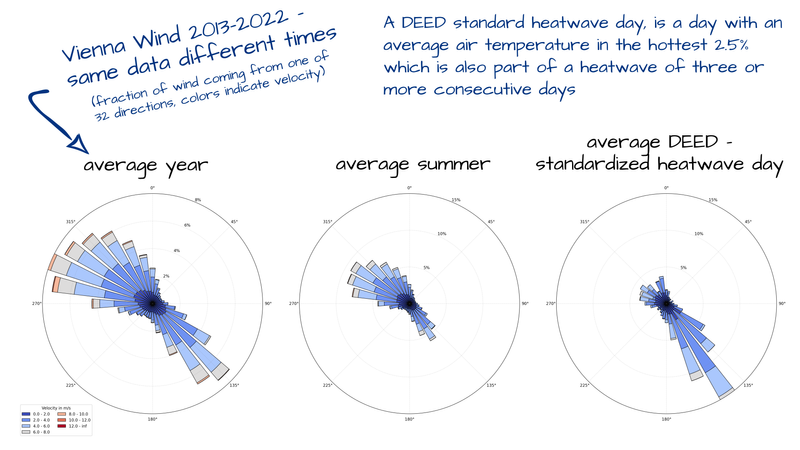
This is where our DEEDS - the Diurnal Extreme Heat Day Standard - shines. It is a globally applicable and statistically well-defined way to calculate the average heat wave day. Most importantly for our case here, the Standard yields the diurnal weather variables of the average heat wave day - that is hourly values. This enables us to focus on the actual conditions for which we want to know the wind velocity and direction. It also enables us to focus on hot weather independent of an actual, arbitrary temperature cutoff: the 30°C air temperature cutoff that we use here is entirely arbitrary. While it might be (somewhat) sensible for Central Europe, it wouldn’t make much sense to use the same number for Southern Europe or North Africa or the Middle East. DEEDS automatically uses the hottest 2.5% of heatwave days with a duration of 3 or more days for the heatwave.

For the image above DEEDS identified 14 heatwaves in the 10 years of data with a total of 61 heatwave days. While the wind directions of the two wind roses are similar, the wind velocity - which plays a major role for health effects of heatwaves - is distinctly different.
Since DEEDS also provides us with the full 24 hours of wind on a standard heat day (and also the average sun position on that day, by the way) we have now finally identified the actual wind conditions for a location. This allows us to do microclimate simulations that focus on the conditions that matter most for heatwaves. The data also allow us to project these conditions into the future, taking into account how climate change will further change the conditions, so that urban planning can also focus on what matters most: creating liveable, climate-change adapted cities.
The data frequency for this analysis is hourly. ↩
Published: