Microclimatic Design Guidelines for Urban Development in Vienna
Urban Development Guidelines Aspern Grüne Saite
Our client Wien 3420 aspern Development AG is running one of the biggest urban development projects in Europe with aspern Seestadt in Vienna. The total area of around 240ha continues to be developed using urban development guidelines to ensure a coherent architectural concept with a focus on creating public spaces that provide highest quality of living, while also looking into the future to create a truly climate-resilient city.
We were invited to provide the microclimatic input for the planning team to ensure that concrete implementation guidelines would optimally serve the vision of a blue / green city planning as laid out in the Strategic Urban Heat Island Guidelines of the City of Vienna. Apart from the aspern Development team, who expertly led not only the process itself but also the organization around it, the specialists of Freimüller Söllinger Architects and D\D Landscape Architecture masterminded the content of the development guideline document. We are also grateful for the guidance by the accomplished experts of the aspern Development Advisory Board. Together, the team was able to realize significant improvements in the apparent temperature (“feels like” microclimate) as the images below show.
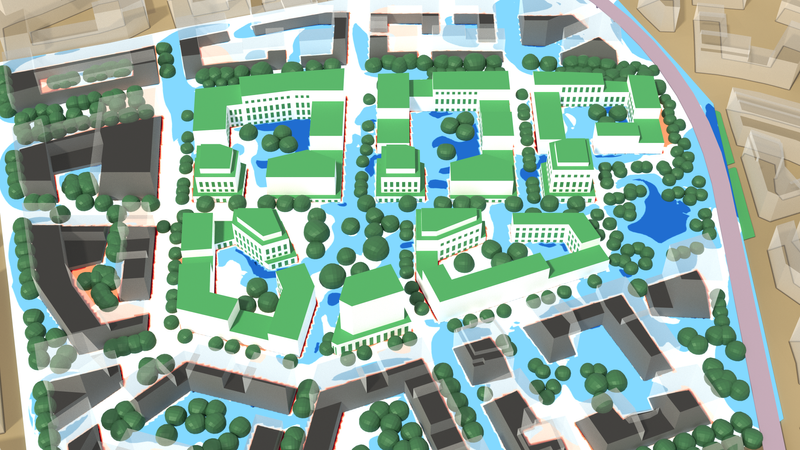
We used a central 3D-Model for interactive discussion in the cross-functional planning team under the leadership of Wien 3420 aspern Development AG. The model went through several iterations as the design team refined its approach and can be found in its final form here: Interactive Microclimate Model Seestadt Aspern Grüne Saite Ost (please allow some loading time).
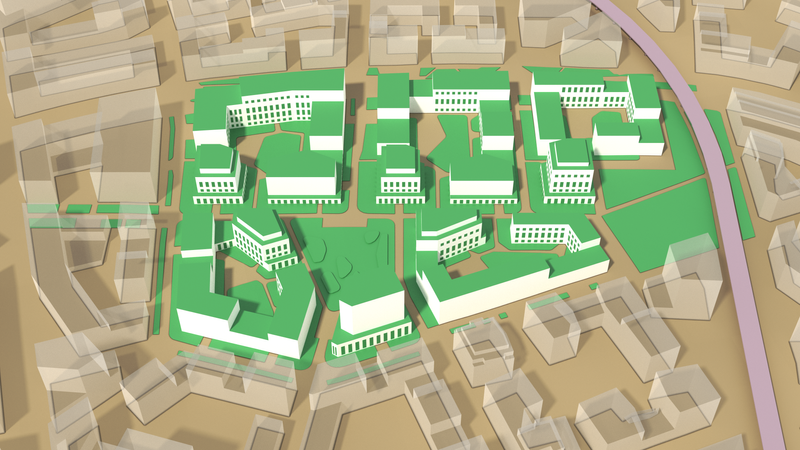
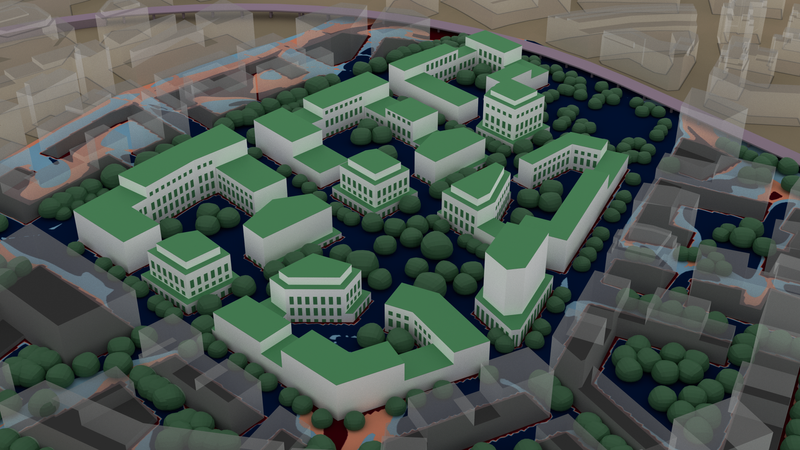
Following the master plan vision

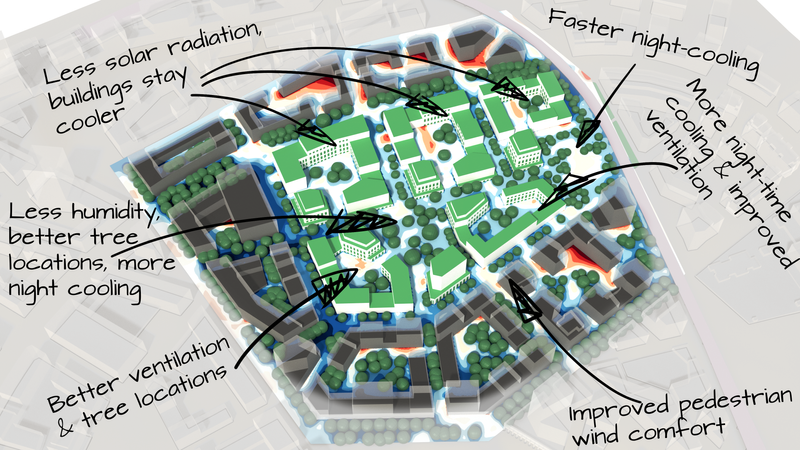
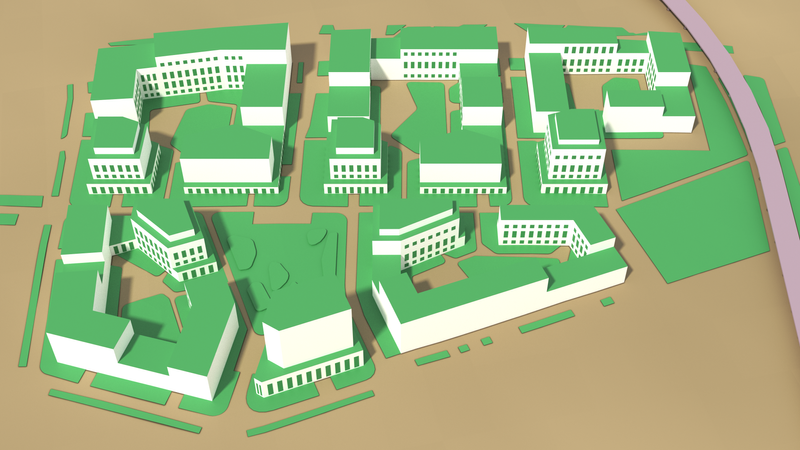
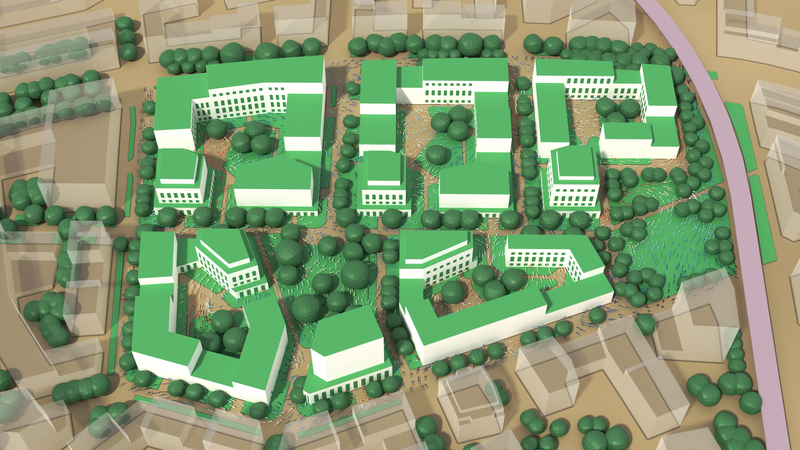
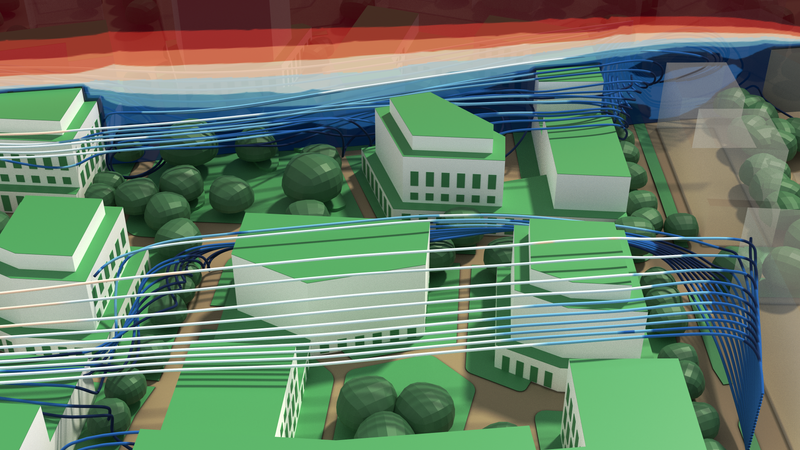
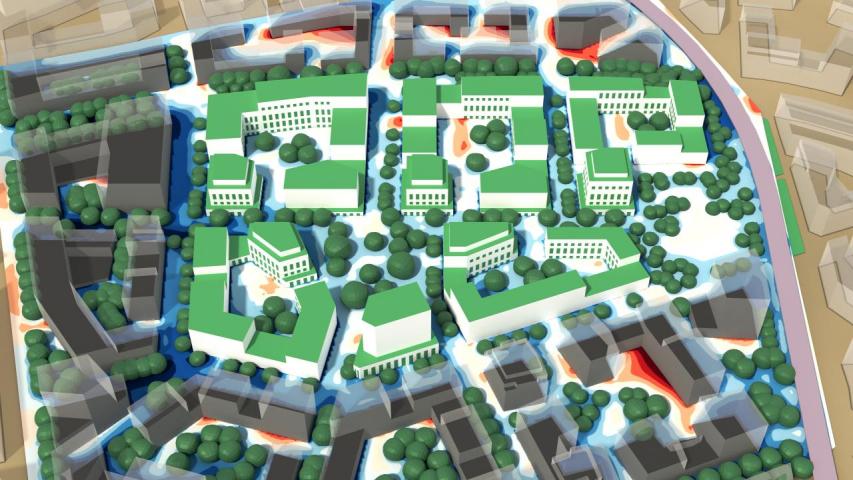
Following the master plan vision, this section of Seestadt also adheres to the principle that public green and blue areas lead, and building volume, height, and design details follow. Generous green space and plenty of trees as well as green roofs and walls throughout the area formed the first, basic planning. Following this, the team optimized tree locations to cast summertime shadows where radiation hits buildings and the ground with the highest intensity. In these places, landscaping was especially careful to propose green walls, to shield buildings from direct sun as much as possible. At the same time, the public areas in these places were designed to be accessible, so that inhabitants can catch early spring and autumn sun when deciduous trees do not carry leaves (yet).
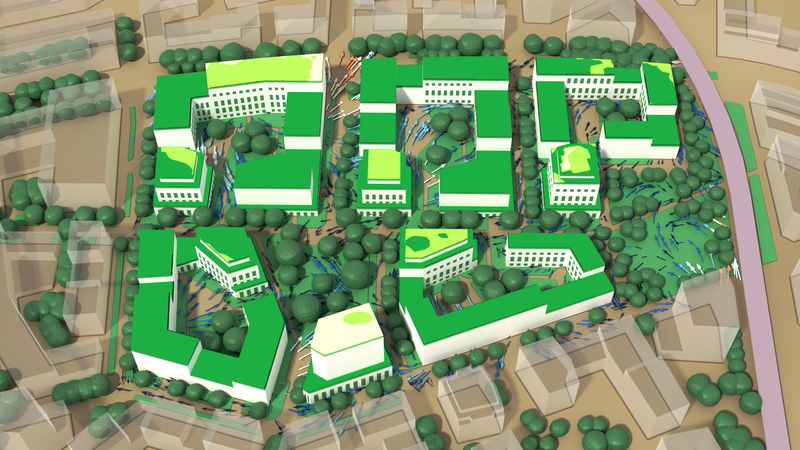
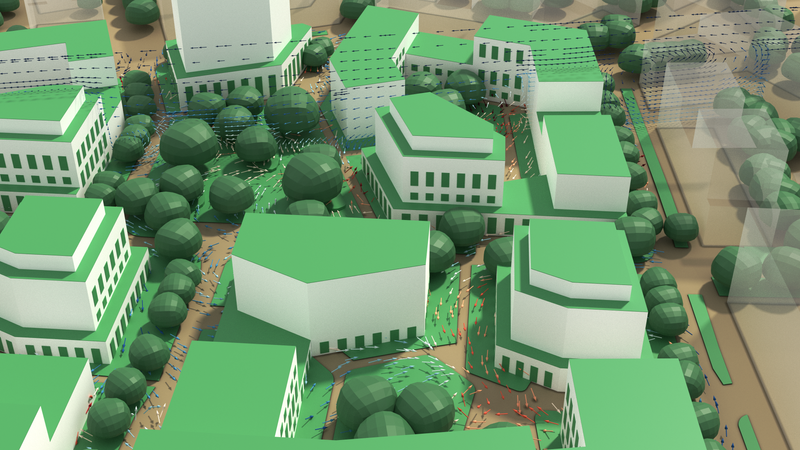
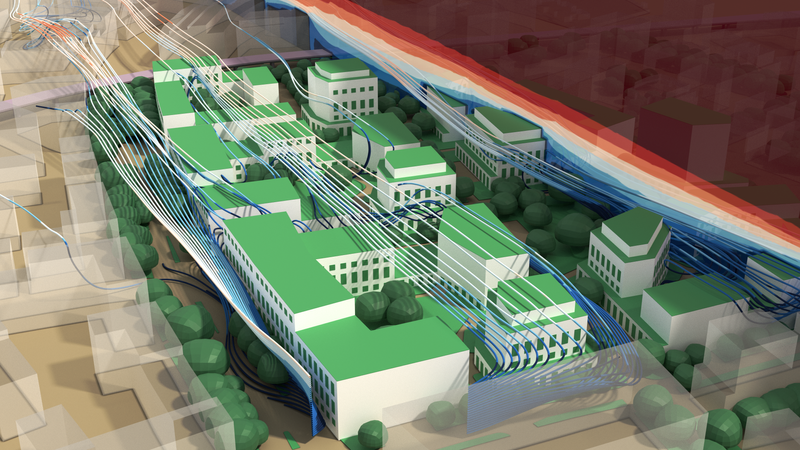
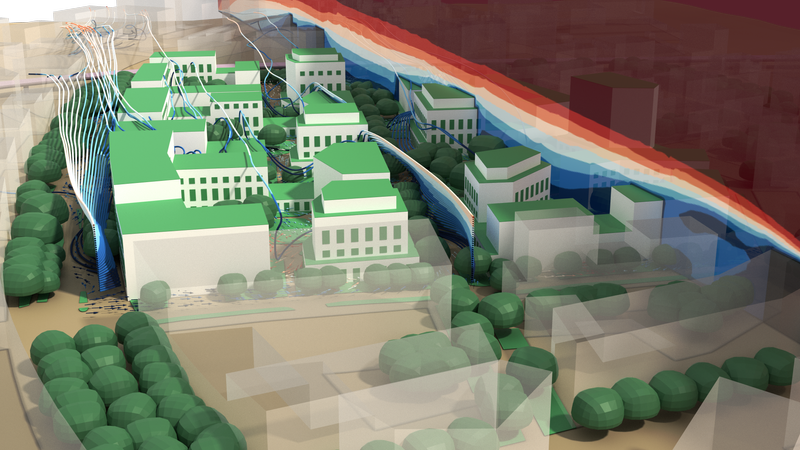
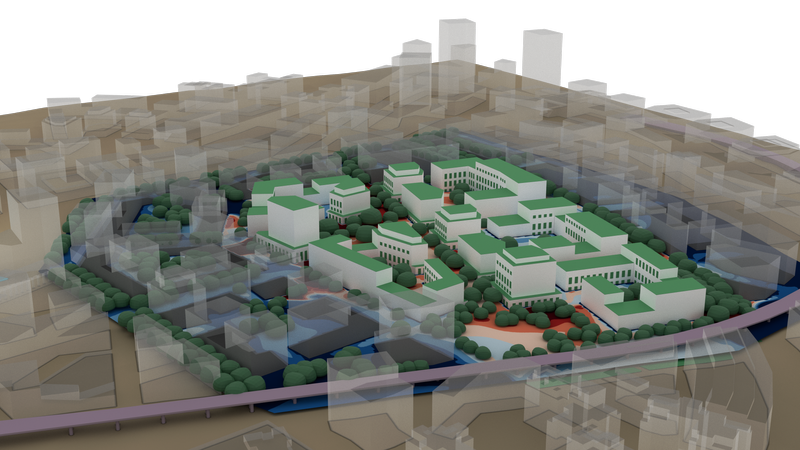
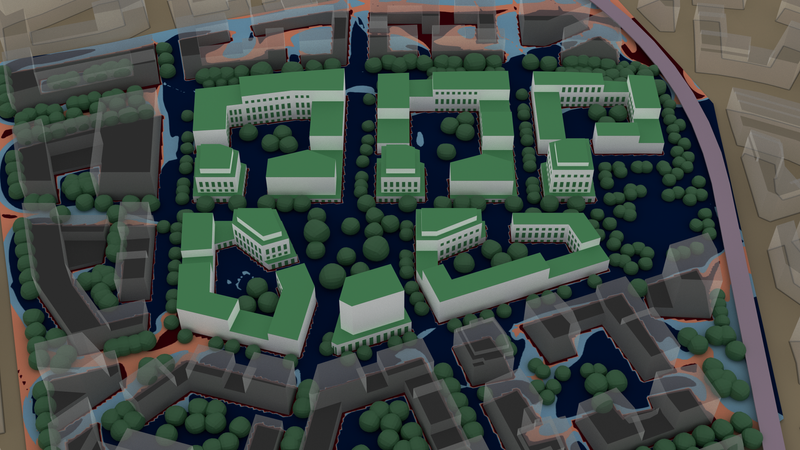
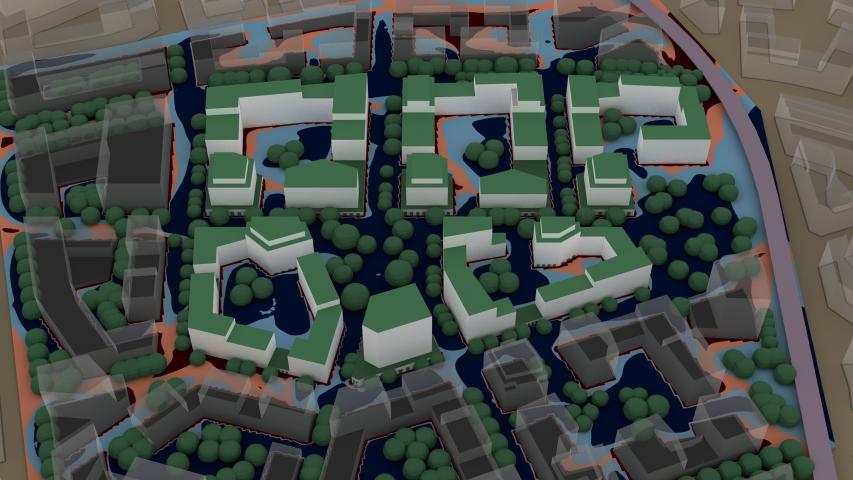
While following the architectural vision, we also worked on adjusting building heights, to allow for the best possible air flow, especially in summer conditions, when air velocity is critical for the felt temperature (see also our article about human thermoregulation). This does not - per se - influence building volume, just its distribution with regard to prevailing winds.
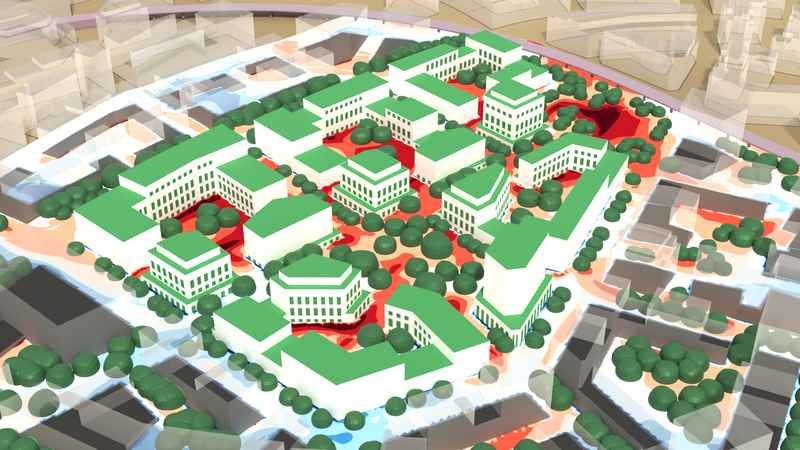
Overall, controlling radiation with shadows from green areas and optimizing air flow will not only result in a pleasant microclimate across the planning area, but also allow buildings to take on as little heat as possible during the day and shed as much as possible at nighttime. This follows our guideline of passive climate mitigation comes first, to minimize the need for active cooling of buildings later (which results in wasteful energy use).
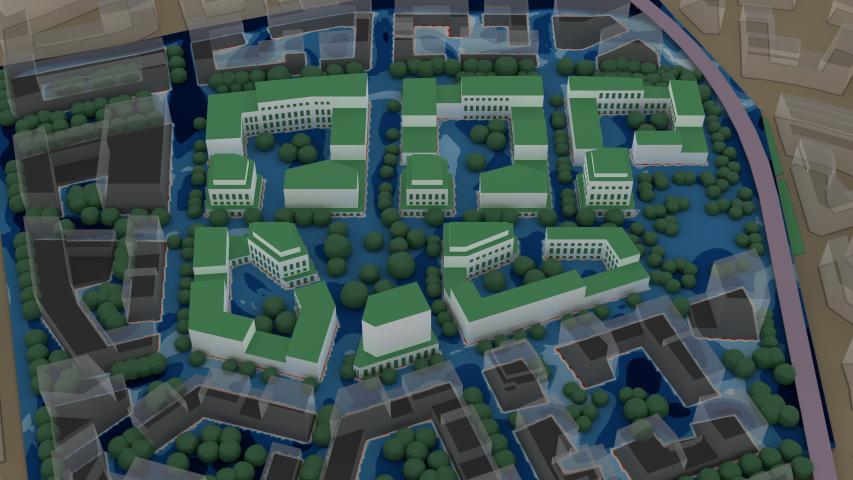
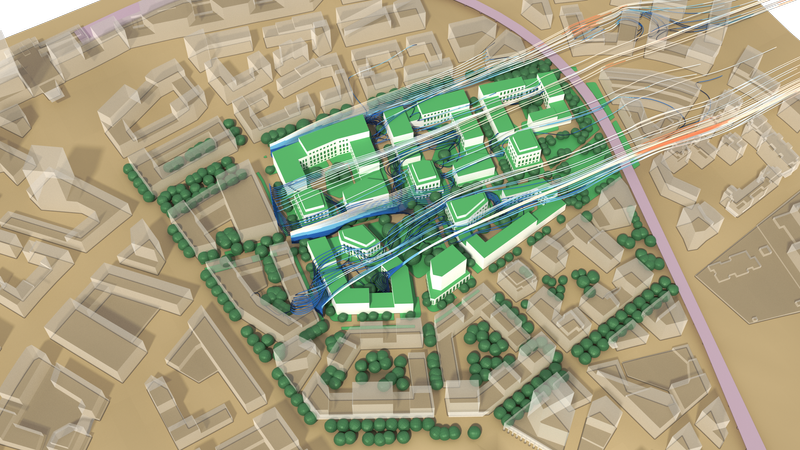
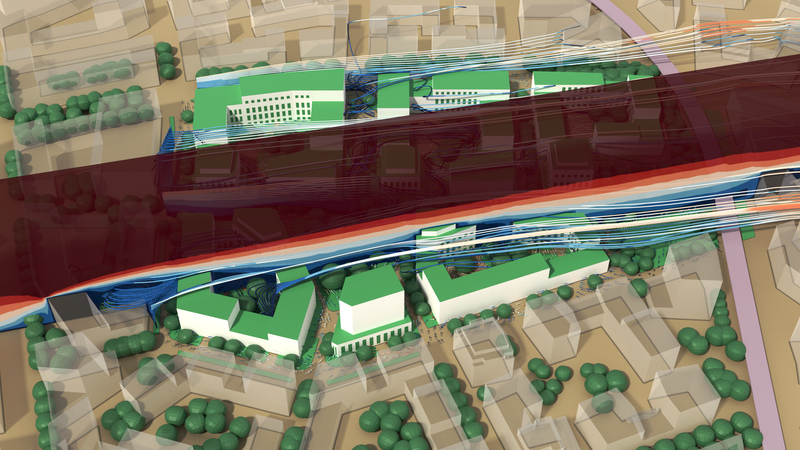
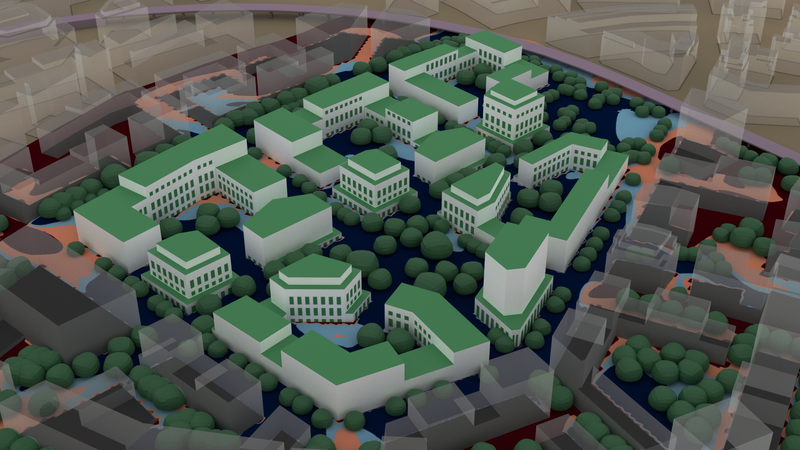
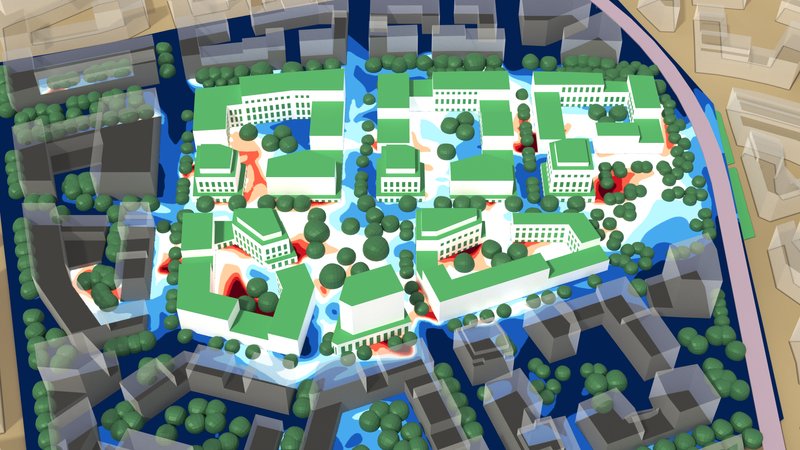
The optimization - especially of the wind flow in the main wind direction for the area, by re-arranging the building volumes accordingly - also led to a more effective cool-down during night. As always, our simulation used actual, historic wind data of the last 10 years to find Weibull-averaged wind velocities for 16 main wind directions. For the diurnal microclimate simulation, we follow actual, measured wind velocity, solar radiation intensity and humidity over 24 hours. All simulations include surrounding geometry to achieve maximum fidelity.
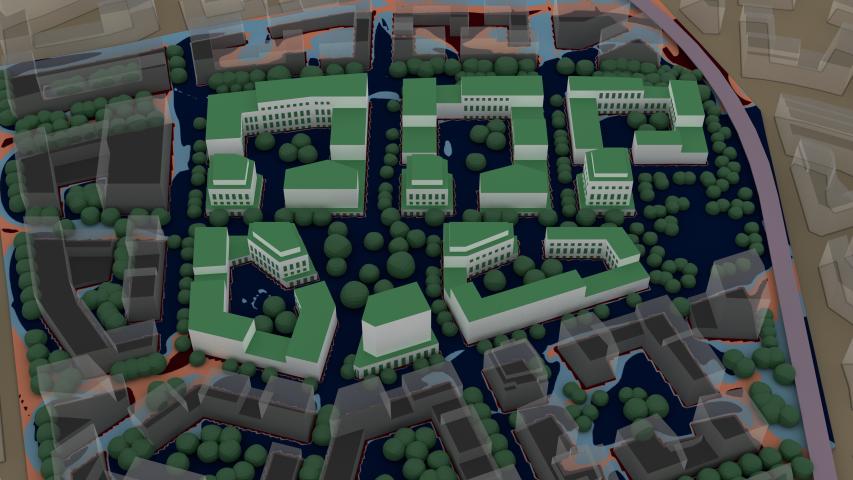
All in all, the team managed to improve the first, already expertly designed planning iteration, significantly and was able to balance the different trade-offs (e.g. more trees - more shadows, but lower wind-flow cooling) to achieve a very performant design, while still allowing plenty of room for architectural characteristics, to achieve a coherent, harmonious urban landscape with highest quality of living even in the light of climate change.
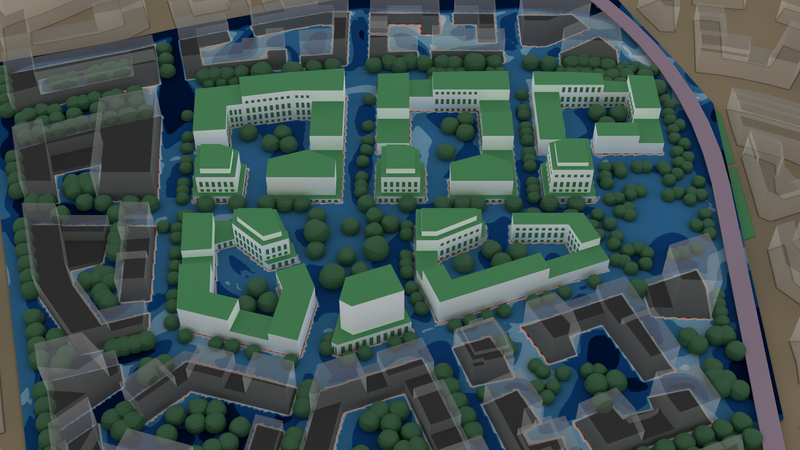
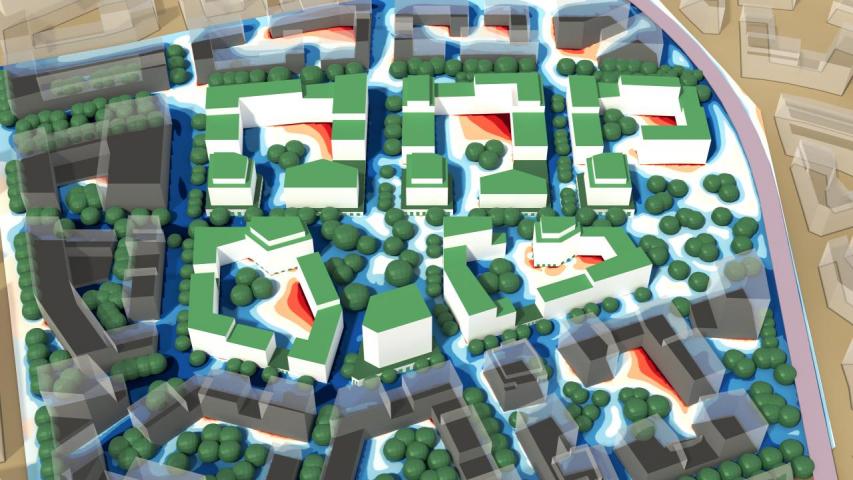
The rendered images on this page are color-coded with the actual simulation results. For a closer look at the scales, please try our interactive online model, which contains all color legends. Please note that in some cases, the same value uses different scales, to better differentiate effects (e.g. nighttime air temperatures).
You can find the interactive 3D model and legends here: Interactive Microclimate Model Aspern Seestadt.
In general, all horizontal, colored planes follow the underlying terrain (respectively surface) at a height of 1.5 meters. This is also valid for 3D wind vectors at pedestrian level.
Published: