Urban Microclimate Simulation Accuracy
When people flee city centers because the heat is just becoming too much, we are homing in on the hottest places in the city to validate our microclimate models. Unfortunately the days of hot weather are becoming more and more, so that the hottest days we simulate in a certain location become increasingly relevant. Recently we took advantage of a heat wave in Vienna, Central Europe to make validation measurements for our Naschmarkt Simulation of one of the hottest places in the city.
Let’s get the suspense out of the way, before we dig deeper into the numbers: despite our model being relatively rough (read more about the simulation here) we were able to hit the absolute numbers very accurately throughout the simulated domain:
Absolute Deviation
Temperature: 0.09°C
Absolute Humidity: 0.0042 gwater / gair
Standard Deviation
Temperature: ±1.13°C (3.57%)
Absolute Humidity: ±0.0019 gwater / gair
In other words: there is almost no measurable difference in the average absolute values for the entire simulation domain and the standard deviation - that describes then span within which ~70% of simulated values are are equal to measured values1 - is also very small with 3.57% for air temperature on basis of °C. The simulation is an excellent representation of the actual conditions! The standard deviation for water in air is a bit higher with 19.83% but this can likely be attributed to local conditions (like dry ground) that we will discuss below.
Our assessment confirms that our simulations for the microclimate during urban heat waves are very accurate in absolute numbers with a relatively low standard deviation (we will go into the reasons for the remaining deviations below) and are therefore confident that also our scenario calculations of future projects are capturing the main influencing effects accurately enough that also implications like health effects (excessive deaths, buoyancy, heat exchange etc.) that all depend on accurate absolute numbers are correctly captured.
Independent verification
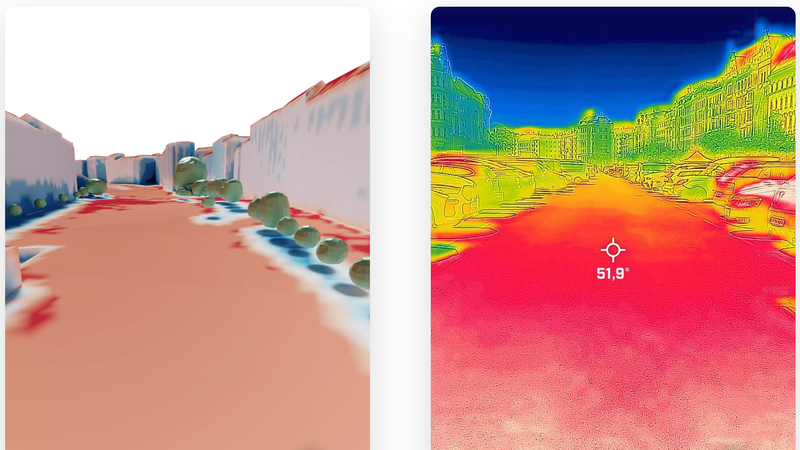
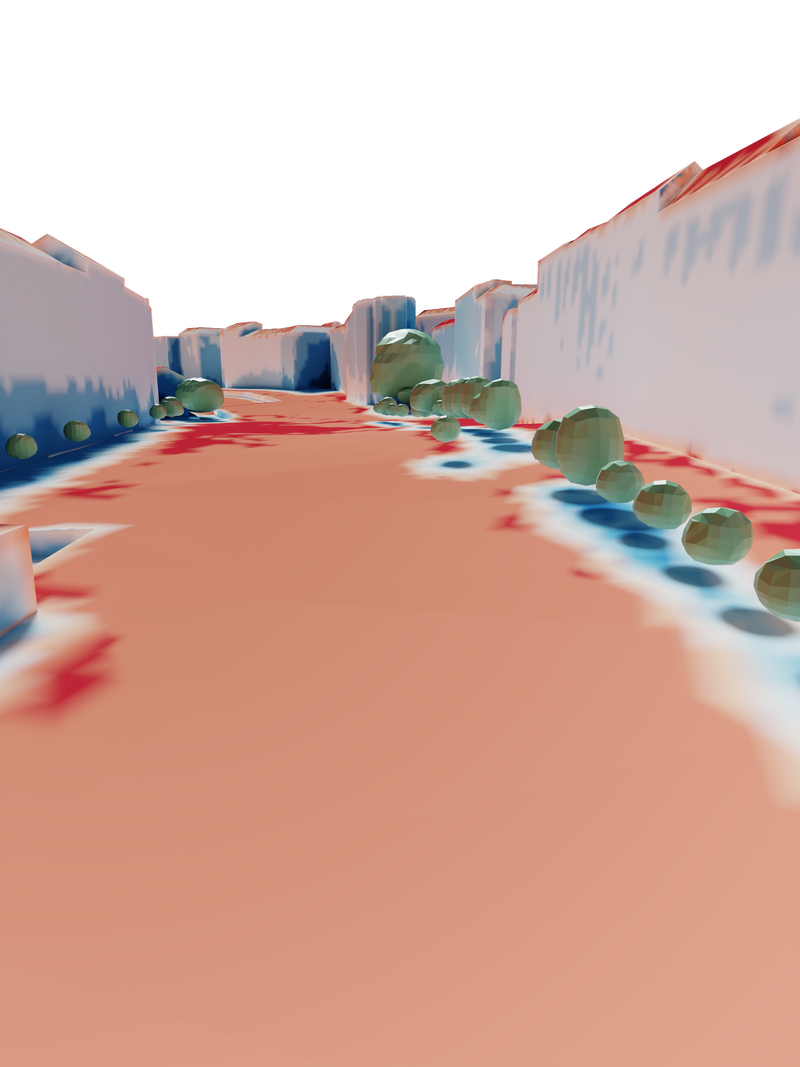
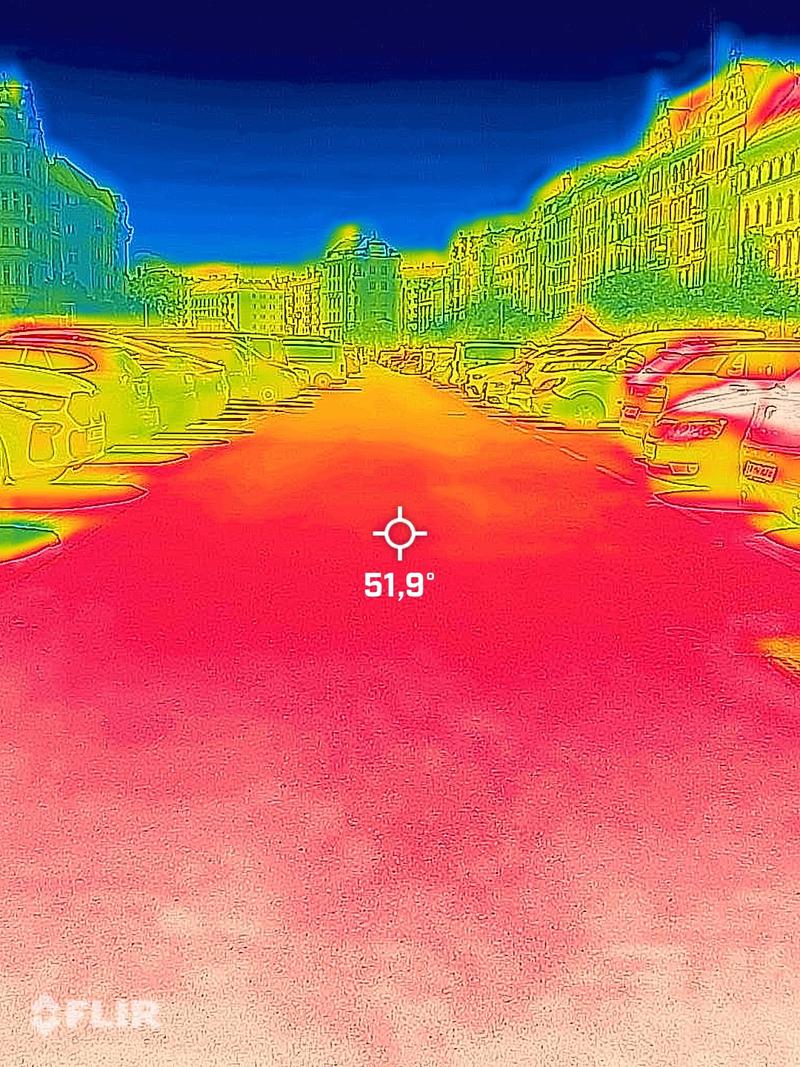
Small-scale urban microclimate measurements are still a rare thing, however in this case we were lucky that - completely independent of our work - some reporters of the local newspaper Falter braved the summer heat and measured some surface temperatures throughout the city. One of the measurements was smack in the middle of our Naschmarkt simulation (see the online 3D model here)) - below you see the measurement and simulation compared.


Despite the obvious differences in the images, like different color scale, focal length, viewing angle, street details (cars, …) it is evident, that the overall picture of the simulation fits the measurement nicely showing the same details: slightly cooler buildings to the left, slightly warmer buildings to the right, hot roofs on the right side, lower temperature around trees etc. The surface temperature deviates only by 2°C in this direct comparison - hardly surprising since the measurement was taken a bit earlier than the simulation snapshot at 15:00 and other issues2.
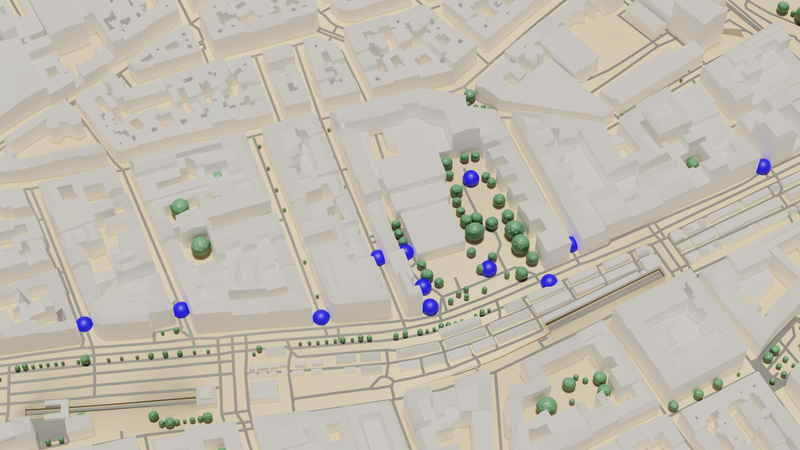
Measurement details
The image below shows the 12 measurement points as blue spheres.

While the standard deviation of air temperatures shows and excellent fit with ±1°C, the simulation differs a bit more for the absolute moisture values even though the humidity values are still very good overall for a simulation of this size and complexity, certainly much more accurate than assuming average water content values over the entire domain and adjusting for air temperature, as inferior simulation methods often estimate humidity (completely neglecting cooling from evaporation amongst other things). There are a couple of reasons for that. The main reasons seems to be the large difference in available water at different positions in the simulated domain. In our simulation we assume, that artificial irrigation provides enough water for plants up to their maximum of evapotranspiration capacity. However in practice, especially areas that are fully exposed to the sun, are much dryer than our idealized simulation assumes, which might well account for the difference. Other reasons might be differences in turbulent mixing or other similar differences in wind conditions (e.g. eddies, fluid-structure-interactions with trees, …) that are difficult to capture but can have a large effect on water distribution in the atmospheric boundary layer close to the surface.

We are aware of some additional influence factors on the measurement, like measurement accuracy of our instruments, the fact that measurements are not concurrent3 and also that the initial simulation was not set up with a very high degree of accuracy to begin with (for example we did not correct vegetation geometry with on-site measurements, did not include cars and moving traffic, …). While we absolutely can model many of these factors, from accurate vegetation over moving traffic to heat sinks and sources like ventilation outlets etc., we simply did not have the necessary data for this particular simulation. We are also omitting a discussion of wind velocity effects, which we have more thoroughly researched in earlier measurements and simulation campaigns already.
In the light of this we are more than pleased with the accuracy of our simulations and can confidently conclude that scenario comparisons will reflect actual effects with a high degree of accuracy.
Impressions & Commentary
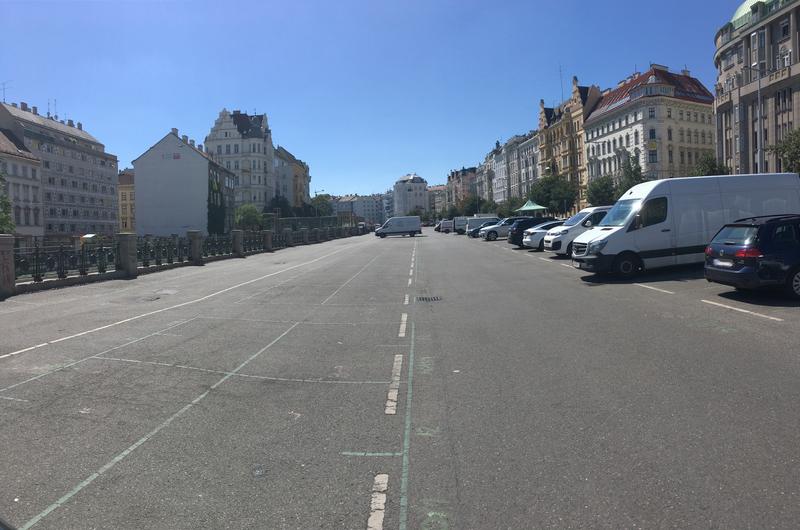
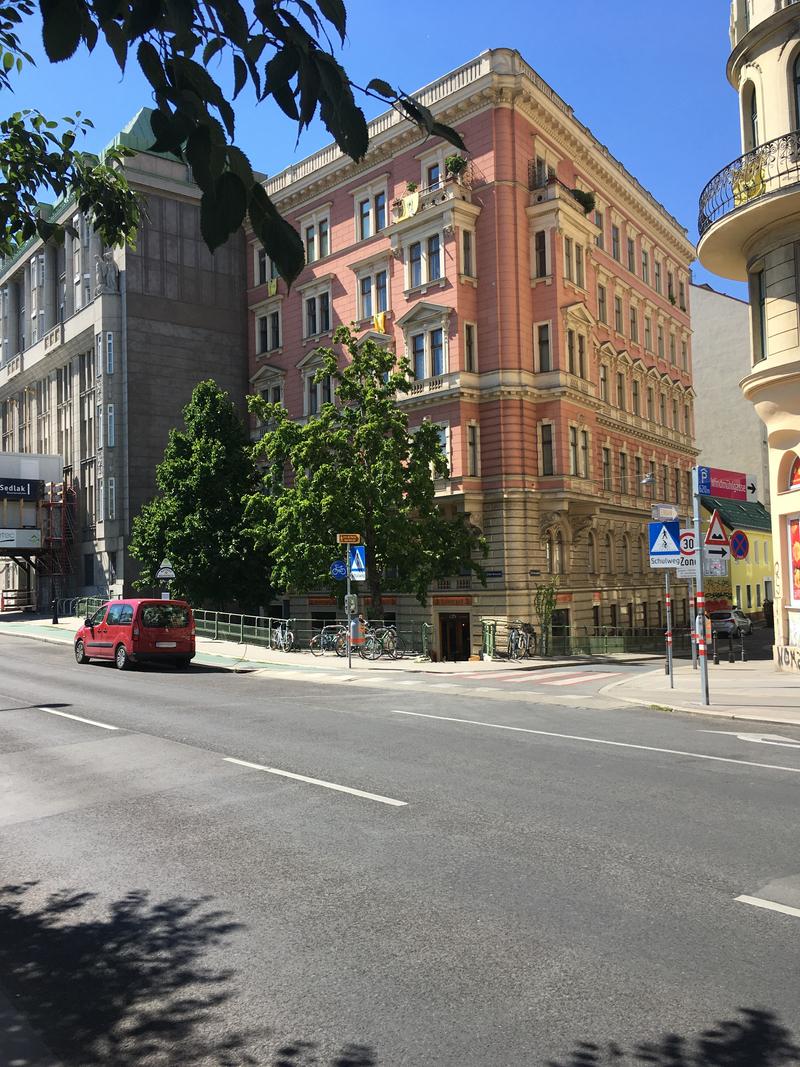
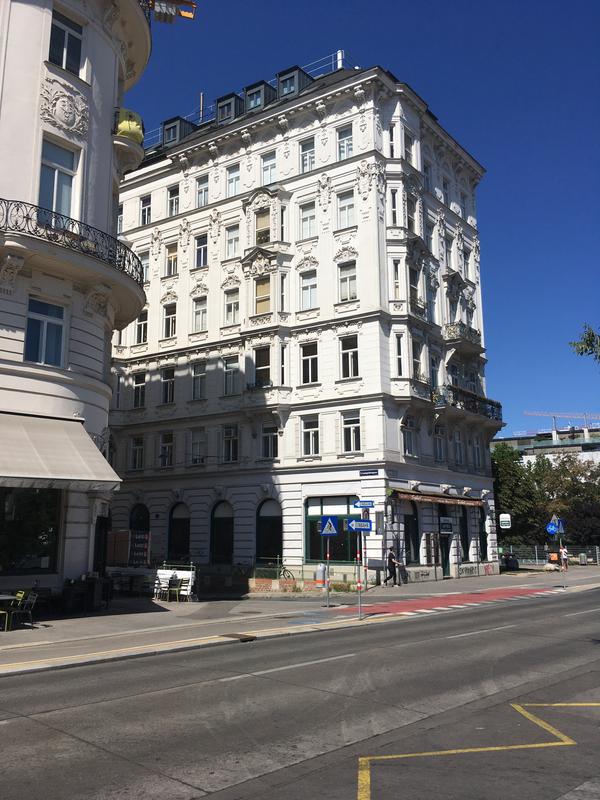
Here are some images of the area, giving an impression of the simulation domain and measurement points. The parking lot is completely unshaded, the perspective is similar to the IR-image and simulation render above.

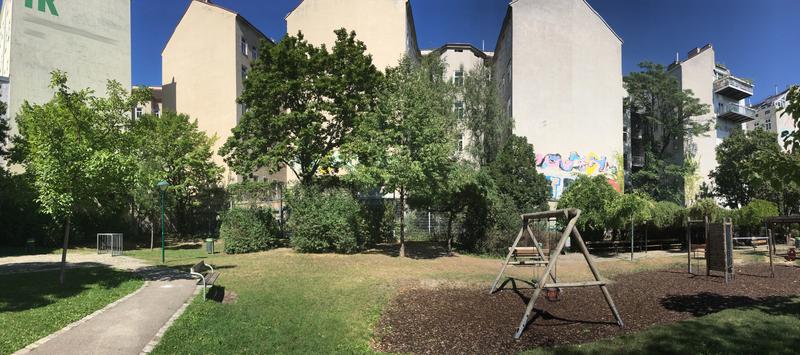
A number of measurements were taken in a park with a sunny and a shady side. The image below shows the sunnier side. From the color of the grass it is apparent that the ground is not fully water saturated, so it is safe to assume that the actual evapotranspiration does not reach its full potential4. Like in the simulation the buildings are partly shaded by vegetation.

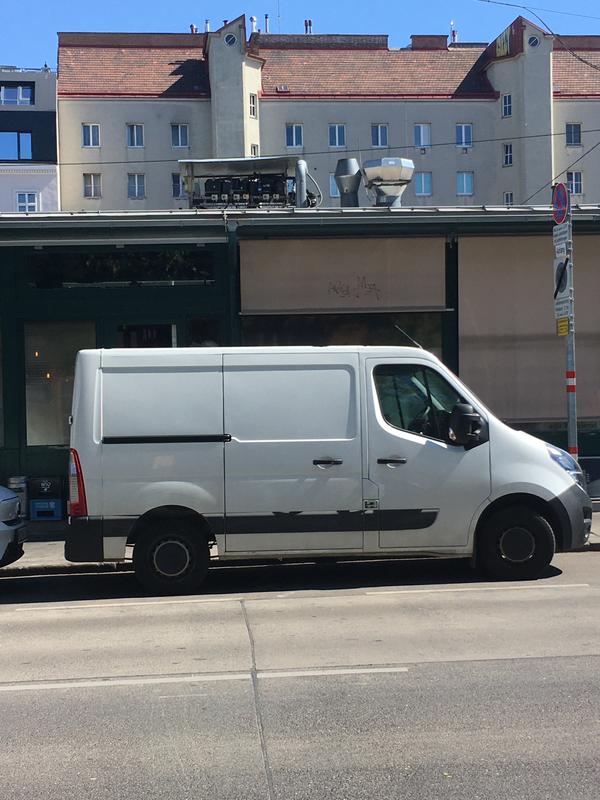
In numerous places businesses release hot air from commercial activities relatively close to pedestrian level. Due to buoyancy effects the hot air will tend to move upwards, however the commercial activity in the area undeniably adds to the overall urban heat island effect. The higher such exhausts are placed, the less influence will be measurable at pedestrian level.


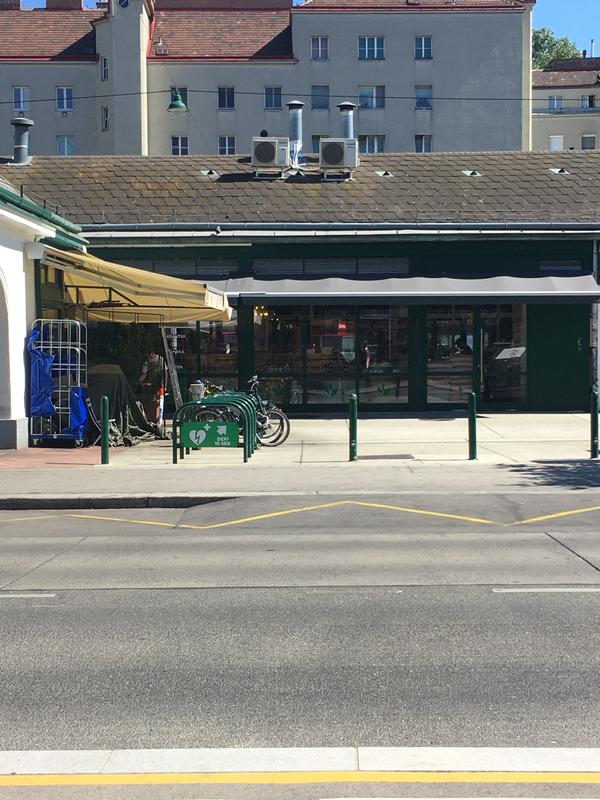
Here are images of two of the measurement locations, showing some architectural detail, actual solar radiation/shade and vegetation in the area. Note how the sun hits only the top half of the building in the narrow side street around 15:00 local time. This changing shading situation, heat conduction in the building and wind velocity are driving factors for the microclimate in this location.


If you are interested in our work, be it for research purposes, urban planning, health management or real estate development send us a message!
More accurately: 68% of all simulated values do not deviate from the true value more than this, respectively there is not statistical difference that can be proven, provided that the measurement values follow a normal distribution. ↩
In addition the measurement shows an obvious temperature dependency on the view-angle versus the pavement, which is a typical reflectance error for infrared measurements - if the image would have been taken straight downwards, the pavement would have appeared hotter than 52°C. ↩
We are moving from one spot the next, which means that measurements are not taken at the same time, but within a certain, short time frame. We did not adjust for this difference in time. ↩
Depending on a number of factors (like soil moisture and depth, tree type, LAI, …), this may - in some cases - result in surface temperatures which are similar to - or even higher than - concrete surfaces and will also result in lower humidity than predicted by the simulation. For a discussion see for example this article in Nature Communications ↩
Published: