
Making Cool Urban Surfaces: The role of water, shade and albedo
In this article we look at surface temperatures in the city, with a focus on green spaces and the role of water. We constantly improve and validate our models with measurements, recently we looked at urban air temperature and humidity measurements, for this article we measured various urban surfaces which allows us also to break down the main influencing factors, that urban planers and architects can tune. As often in nature, the principles are simple, but their interactions create a complex environment that needs careful planning to yield optimal solutions to mitigate effects of urban heat.
Our little experiment can be summarized like this: irrespective of the (unsealed) surface, the biggest influence on surface temperatures is ground moisture. This is largely independent of the type of ground and equally applies to soil and inorganic surfaces alike - dry surfaces are always considerably hotter than moist surfaces - this is true for urban ground, green roofs and green walls.
Following that, the next biggest influence factors are shade and albedo, with shade being the preferred method to keep outdoor surfaces cool and high albedo being the method of choice to keep built structures cool. For shade, large trees are best, but any technical shading structure brings considerable benefits. High albedo surfaces should be used preferably for vertical surfaces especially on top of structures.
Here are some very succinct guidelines for urban planners and (landscape) architects to follow, to create cool urban landscapes that will mitigate climate change for citizens:
Cool Urban Guidelines:
Create structures that retain water, are self sufficient with respect to irrigation and resilient against drought.
Keep structures cool indoors by using high-albedo surfaces and shade outdoor areas to increase sojourn quality.
For the all important night-time cooling it is additionally important to create urban geometries that allow heat gathered over the day to be radiated into space and grant cooler night-time air optimal access to surfaces to foster convective cooling. We have discussed this issues in other articles about our simulations (see for example the section here about optimization of urban night time cooling), for now, let’s look at surface temperatures and some details about out little urban measurement expedition.
Seasonal Climate Conditions
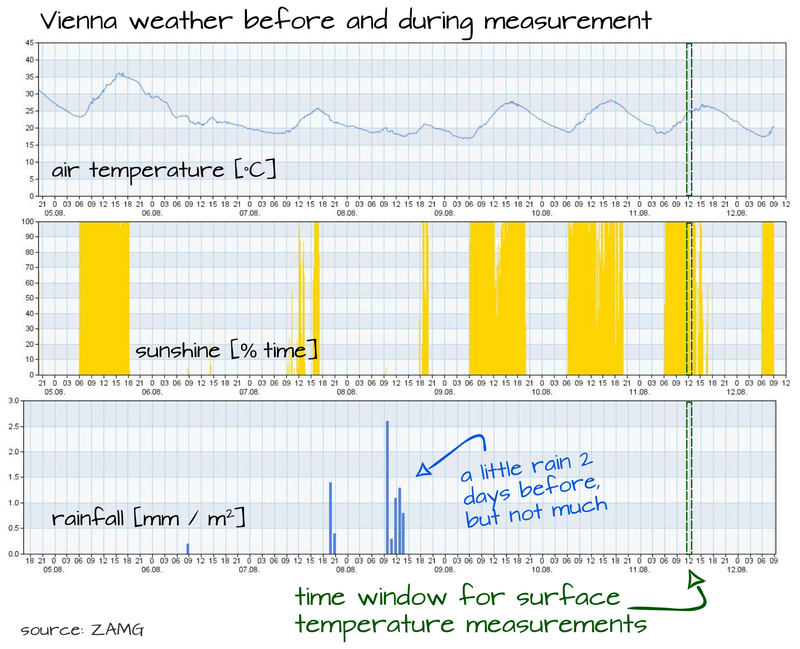
Before we dig into the surface temperature measurements, let’s take a brief look at the weather conditions during and before the measurements, since these play a crucial role, as we will see later. The measurements were taken on August 11. 2022, a moderate summer day in Vienna, Central Europe, with an air temperature of 25-26°C, some light cloud cover and a relative humidity of ~35 %; wind velocity was also typical with about 2.5 m/s. The graph below summarizes the conditions.


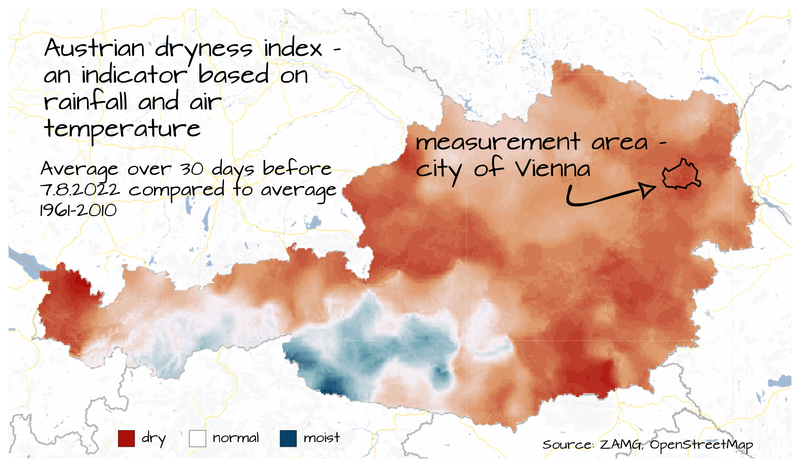
As the graph shows, there was a bit of rain two days before the measurement but in general Central Europe was under considerable drought stress at the time, which is also apparent in the graph showing the Austrian drought index for the 30 days leading up to the measurements. While not quite in a full blown drought, the map shows that there is definitely water stress in the area. Detailed data of rainfall shows a rainfall deficit of 30-50% versus the long-term average at the measurement site. The same is true for the majority of the European continent, with most of it experiencing at least moderate and sometimes severe water stress in the summer of 2022, up to and including the need to limit consumption by decree - details can be found on the website of the European Drought Observatory.
Measuring surface temperatures in an urban park
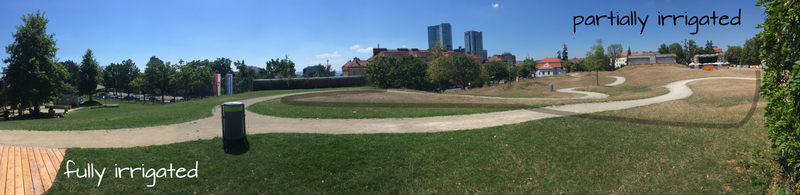
With the overall summer climate discussed, lets look at the measurements. The measurements of dry and moist grass, gravel walks and shadow/sun were mostly taken in the area of an urban park with playground. Looking at the park it is easy to identify two distinct sides: one side with lush green grass and trees and the other side, that seems under considerable water stress with dried out grass and cracked ground. Clearly it seems like the green half is well irrigated, while the other half is not and only receives water in places where trees are planted. There could be other reasons for this difference, especially underground structures and soil depth, however for lack of data we must neglect these and assume that all or most of the difference in the condition is due to irrigation. In any case, we are looking at a single measurement site with one half moist and the other one pretty dry1.

This is also apparent from satellite imagery - even though the perspective is slightly distorted and the recording time of these satellite images is unknown, it is apparent that dryer conditions do affect the left part at least sometimes:
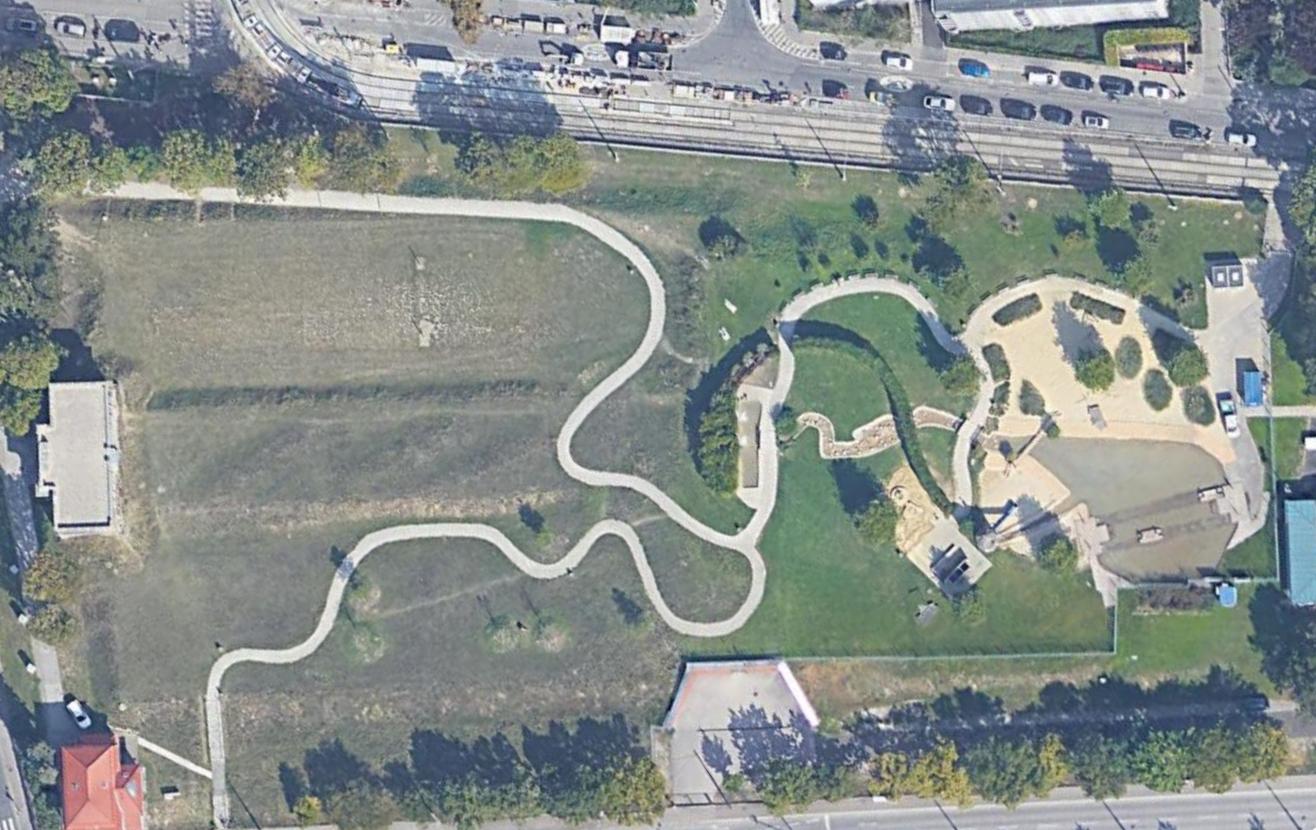
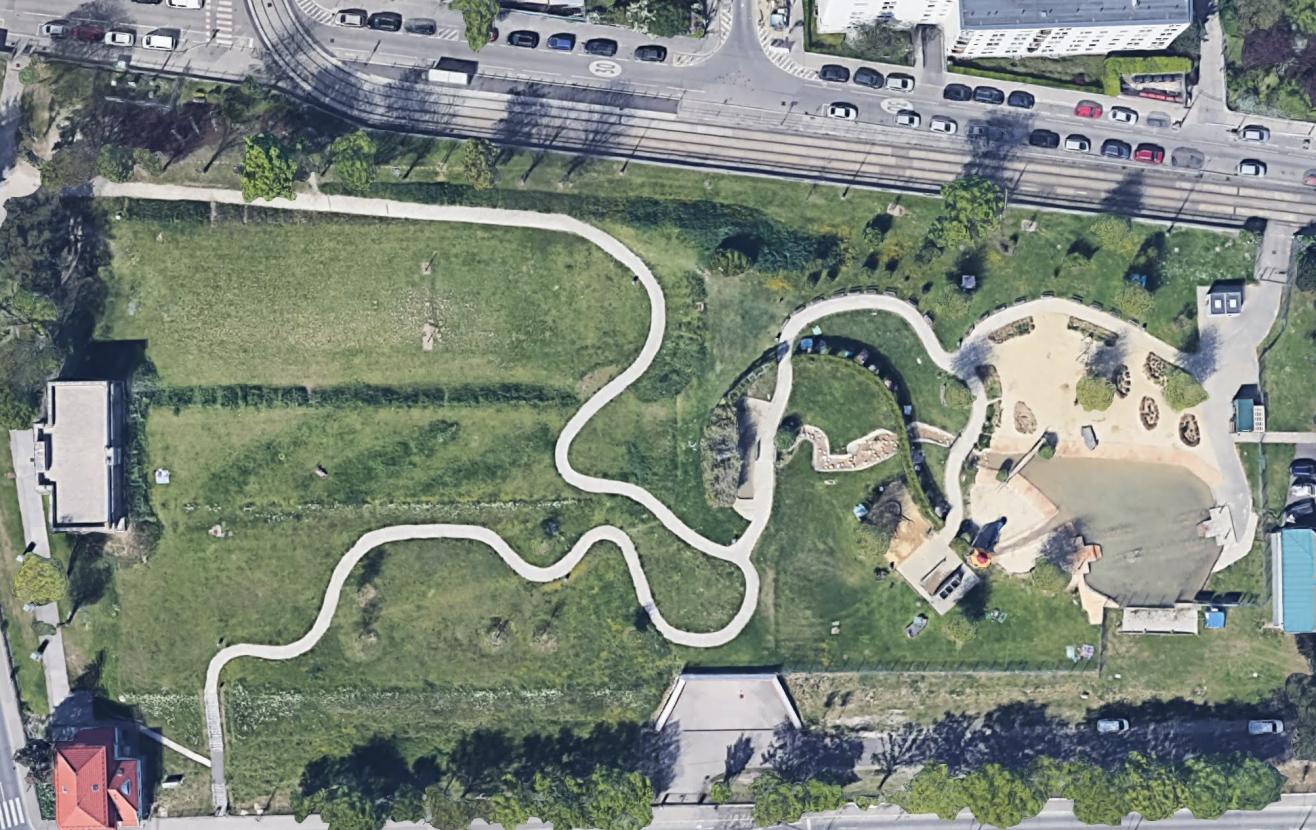

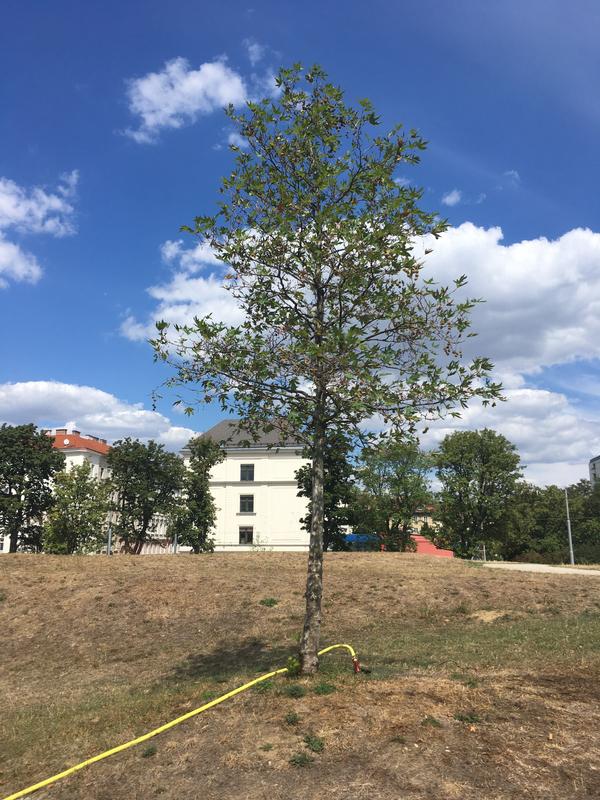
It is also worth to note, that the trees in both parts of the part were planted at the same time but show considerable deviations in crown size even though the trees on the left, dryer side of the park are irrigated regularly too as the images below show. Even so, they seem to be under considerable water stress. The delayed growth compared to the trees in the moist side of the park may also be due to differences in the ground, like for example soil depth, but whatever the reason, the net effect is, that these trees struggle and hardly give any shadow.
Surface temperatures
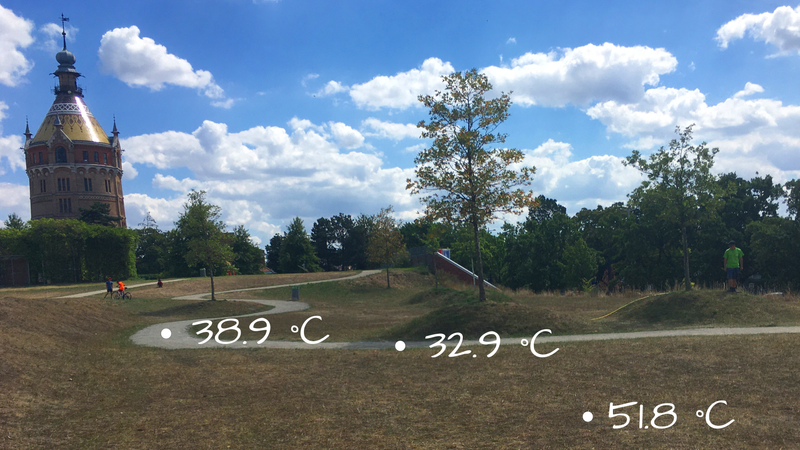
With the lay of the land explained let’s discuss the actual measurements. Despite the very moderate summer day with an air temperature of around 25°C and some clouds in the air, the surface temperatures in the dry part were pretty high.

It might seem counter-intuitive that the gravel walk has considerably lower temperature as the grass, however due to it’s much lighter color, the gravel has a higher albedo, which means that more sunlight is reflected back into the sky and the ground stays cooler than the relatively dark, brown grass. In this case this means that the gravel is almost 13°C cooler than the dry grassland. Gravel in the shadow is still cooler by 6°C. Please note, that other effects, that were not assessed may influence this - for example difference in porosity and moisture, heat conduction underground and even the surface roughness (which influences heat exchange with the air) are also factors.

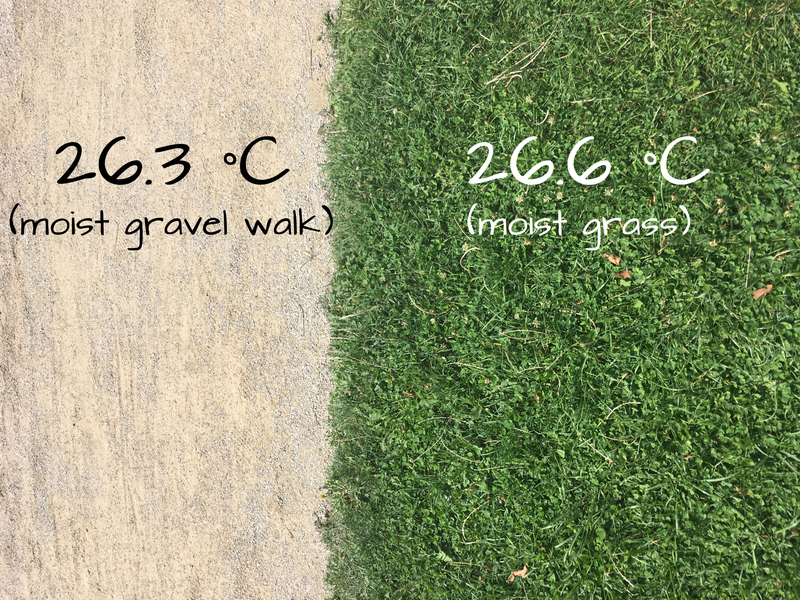
Let’s take a look at the irrigated part of the park. Measurements were taken from well irrigated green grass and also the gravel walk, that was inside of the irrigated area. The measured surface temperatures differ a lot less than in the dry part of the park. But also here we can see that the material with the higher albedo - the light gravel - is cooler than the darker grass. Judging with the naked eye, the moist gravel seems darker than the dry gravel, which could also be an influence factor for the surface temperature difference.1
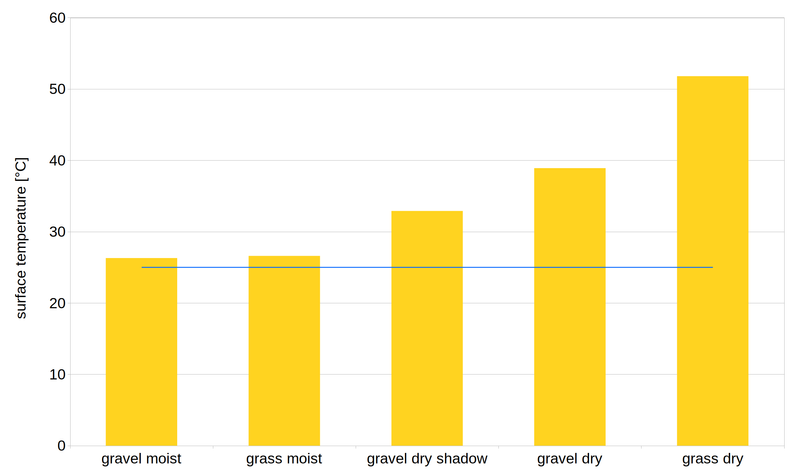
So let’s summarize the measured surface temperatures: wet respectively moisture-saturated surfaces showed temperatures close or slightly above the air temperature, while dry surfaces were considerably hotter. For dry surfaces, the major influence factors are albedo and shadow.

Conclusions and Outlook for Urban Landscaping
Despite the small size of our little measurement experiment we can draw some important conclusions as general guidelines for how to design resilient, climate-adapted urban landscapes. So what do we learn from these numbers for creating better urban environments?
The role of water
The first conclusion is obviously the importance of water. Without sufficient water, there is no irrigation with obvious consequences for the urban landscape. When designing green urban areas, planners need to be mindful of the projected availability of water. Conversely, all technical means that retain water in the city instead of draining it will be advantageous in areas with sufficient rainfall. There are for example different forms of green roofs, some that can store considerable amount of water and some that don’t. The latter will either need irrigation during droughts (which might be prohibited to conserve water) or will show similar surface temperatures as the dry grassland above in which case there is hardly a point to justify the cost. An additional consideration are plant species - planners are well advised to select species that are tolerant against drought conditions.
While we did not mention this above, we also did some measurements of green walls with the results being very similar to the ground measurements: in the presence of water, the surface is cool, otherwise hot (irrespective of even having living plants on the wall!).
The goal for sustainable future green spaces is simple and clear: Create structures that retain water, are self sufficient with respect to irrigation and resilient against drought.
Shading and Albedo
The second conclusion to draw is all about radiation management. Let’s briefly mention the separate effects of reflection: Highly reflective surfaces keep things cool that are behind them, but increase the radiation density for everything in front of them2. For example: a white wall will keep the inside of a house cooler, but pedestrians in the street will feel more radiation since in addition to the direct radiation they are also subject to the reflected radiation.

What does that mean for planners? When designing the built environment it makes sense to use high-albedo (highly reflective) surfaces on top of structures respectively on horizontal surfaces that reflect towards the sky, so that energy can be radiated back into space and not towards pedestrian level.
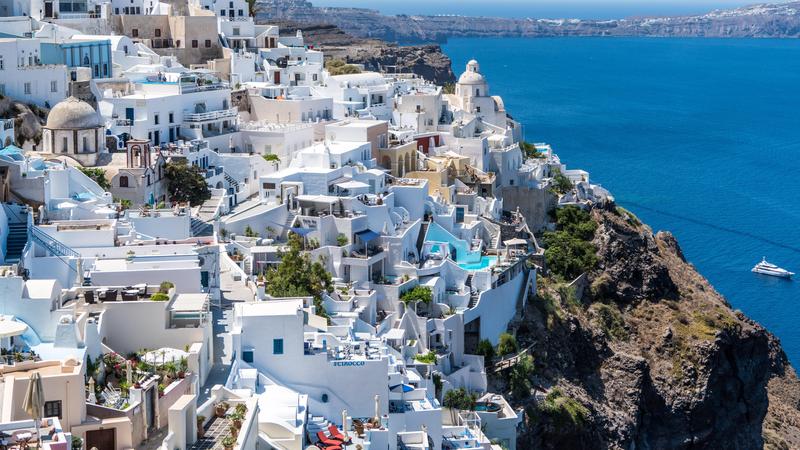
A practical example of this are traditional mediterranean towns with their white surfaces - in this case there is also a social adaption to hot weather in play since it is common in the area3 to close businesses between 13:00 and 17:00, the hottest time of the day. Vertical reflective surfaces are less of an issue when most people spend this time indoors.
Conversely to protect citizens that are out in the open during the day, it is important to use any means of shade that are available. Trees are an excellent option (if enough water is available) since in addition to shading, they cause slightly elevated wind velocities underneath and keep heat above pedestrian level through evapotranspiration in addition to reflection. However all shading devices will provide a fair amount of protection.
It’s important to note that shading devices often present a tradeoff between different goals: While shading is beneficial around midday in summer, it slows the nightly cool down (can be an obstacle to long-wave radiation and wind-cooling) and may block an uncomfortable amount of light in other seasons.
The conclusion can be summarized like this: Keep structures cool indoors by using high-albedo surfaces and shade outdoor areas to increase sojourn quality.
Scientific evidence

While our little measurement experiment covers only a single example in one city, it fits very well with the findings of large-scale scientific remote-sensing science. In the scientific nature communications article The role of urban trees in reducing land surface temperatures in European cities (open access), the authors use satellite data to measure / model surface temperature differences between 100% urban areas (no vegetation) and 100% green areas (urban grassland and urban forests) and reach very similar conclusions as the ones we presented above.
For Austria, the authors predict that (moist) tree areas have around 12°C lower surface temperatures than the urban fabric. In our measurements this difference is 12.3°C (moist grass near trees vs. dry gravel walkway). The paper also shows that in very dry areas4, the urban fabric can be cooler than the green areas - in our case, the dry gravel walkway is cooler than the surrounding dry grass, due to its lighter color (= higher albedo).
A little caveat is in order at this point: in our discussion we focussed on surface temperatures. These do not directly translate into air temperatures nor into physiological temperatures that determine human health and thermoregulation during hot weather. We have discussed the relationships between these in various other articles on our website and will therefore omit this discussion here.
From Science to politics

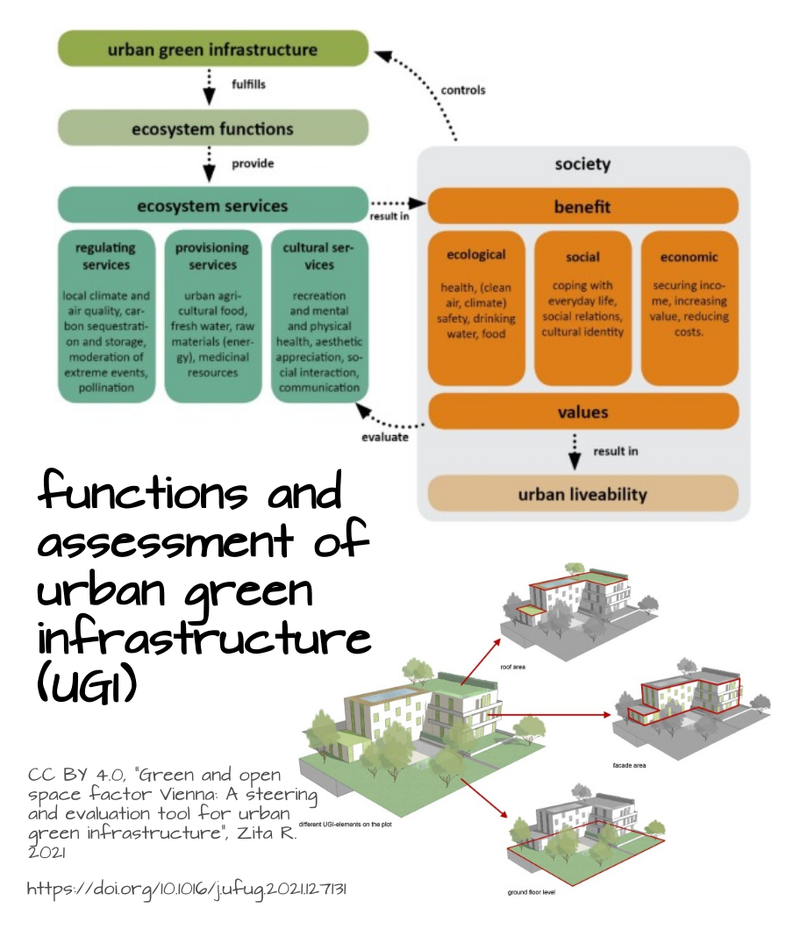
It’s worth to note that urban land management is naturally governed by great number of other factors beyond climate, from political over economic to social factors. Increasingly scientists argue for the introduction of policies, that weigh these objectively and can therefore serve as guidelines for also private developers. Expressions like ES (Environmental Services), UGI (Urban Green (and blue) Infrastructure) and NBS (Nature-Based Solutions) are becoming adopted in urban planning, a development we wholeheartedly welcome. Behind these terms is the underlying idea, that the urban fabric is serving a number of different functions from microclimatic over water management, biodiversity to recreational functions, tourism and social cohesion5.
Adoption of such paradigms makes it possible to increasingly integrated urban green infrastructure into the traditional urban setting, so that the distinction of 100% urban vs. 100% green becomes less stark and cities not only cooler but more liveable altogether. One such approach is for example the Green and Open Space factor (open access article) that sets various functions of UGI (climate, biodiversity, well-being) into relation to the land use, with separate consideration of elements like green walls, that are traditionally not considered. While in early stages of adoption, and probably in need of additional factors like irrigation and albedo, we do think that approaches such as these can be good a basis for coherent policies to develop climate-resilient urban landscapes.
If you’d like our support in planning your project, just send us a message!, we are happy to talk! We are also open to participate in research projects that fall into our area of expertise.
Please note that while we did our best to measure representative numbers, we did not conduct a full-blown scientific measurement campaign with randomize measurement points etc. However we did take several samples in different points, removed outliers and represent the remaining values as averages in this article. We also did not assess soil depth, measure soil moisture and albedos of the various measured surfaces, all which would be done of course in a scientific measurement campaign. ↩ ↩2
We use in front and behind a bit sloppy here - actually we are talking about the direction of the original incoming radiation. ↩
Resting time during the hottest time of the day is common in many areas with hot climate, often this is referred to as Siesta. In the future it might make sense to introduce similar practice in more southern or northern cities where this is not commonly practiced today. ↩
More correctly: in areas with low evapotranspiration (ET), but in our case basically translates to dry, though there are other possible reasons for low ET. ↩
For a short introduction see the open-access article Integrating Ecosystem Services, GreenInfrastructure and Nature-BasedSolutions—New Perspectivesin Sustainable Urban Land Management by Dagmar Haase, Humbold-Universität Berlin ↩
Published: