Berlin UZNH - intermediate report wind & microclimate
The agency of urban planning in Berling is currently working on the master plan of the „Urban Center Neu-Hohenschönhausen“ (UZNH, link target in German). The goal is to create an urban center for a city district with a vibrant, inclusive neighbourhood and a rich environment with services, restaurants, retail shops, child care facilities and more. The city district will build a culture and education center, the residents will live in a well designed environment that will allow different forms of housing. The winner of an architectural competition superwien and Studio Boden are currently working on the master plan as basis for the ongoing development of the project.

Rheologic was asked by the Berlin District Office of Lichtenberg to support the process to allow the developers to optimize the wind and microclimate conditions of the master plan. The microclimate in cities shows an urban heat island effect: beyond the global warming, cities are often warmer than the surrounding rural areas. By planning the building envelopes and urban landscape appropriately this effect can be minimized and the quality of living for the residents optimized.
From our microclimate simulation of the initial master plan, 13 recommendations to improve the local microclimate were worked out. The recommendations will be assessed according to the intended usage scenario of individual areas within the development project and weighed against any conflicting goals (if any). After integration into the master plan, another simulation will confirm the improvements and allow last corrections if necessary.

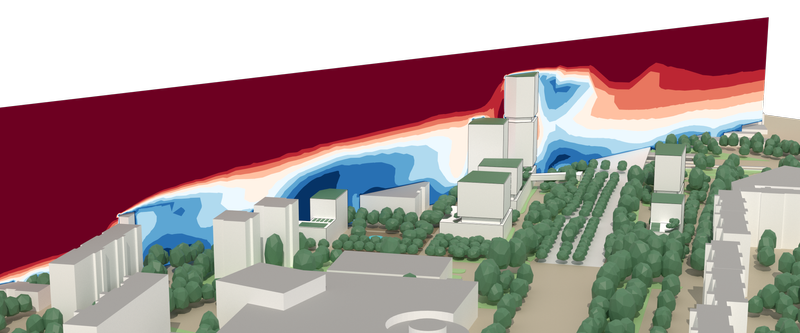
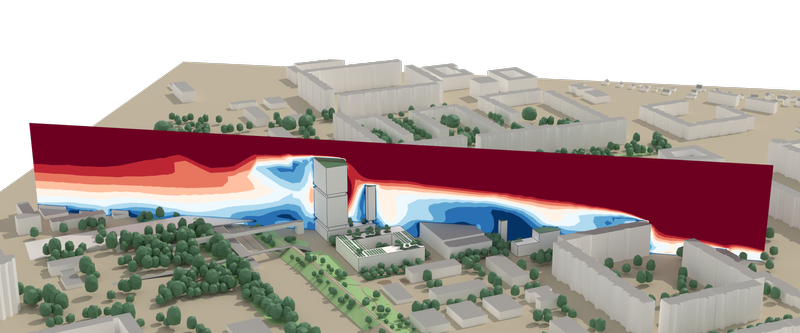
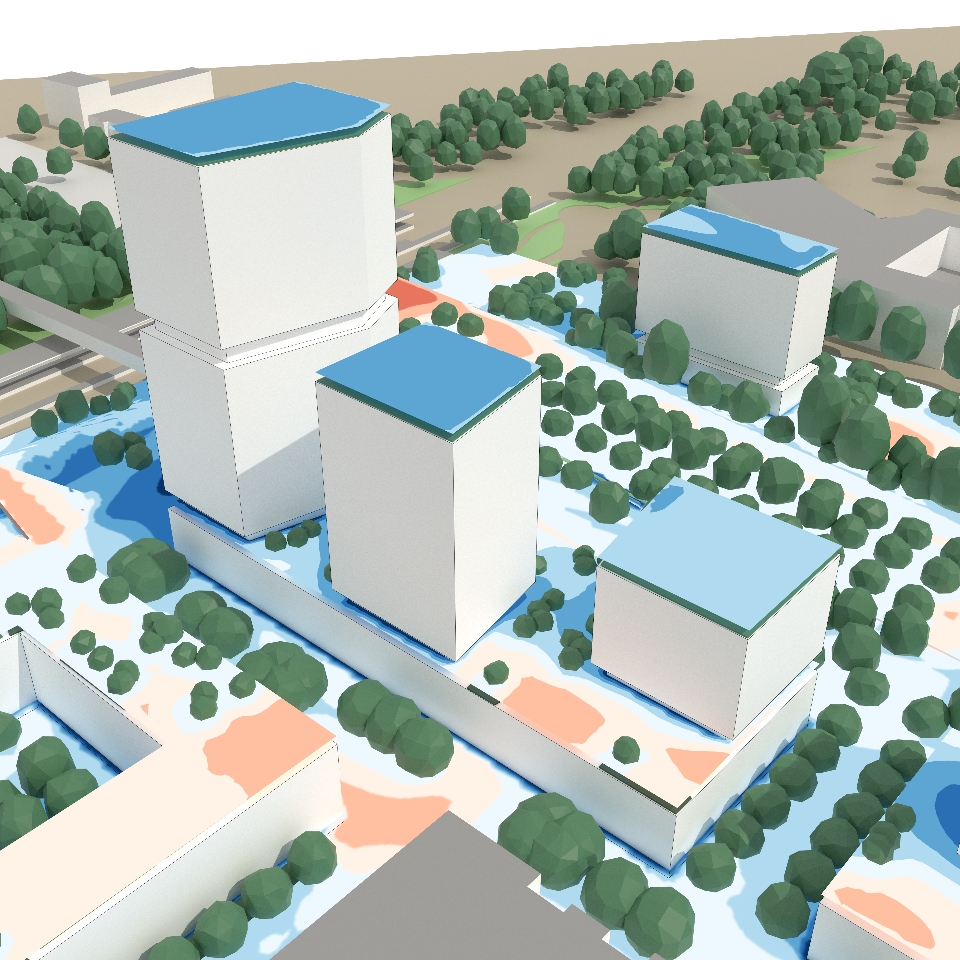
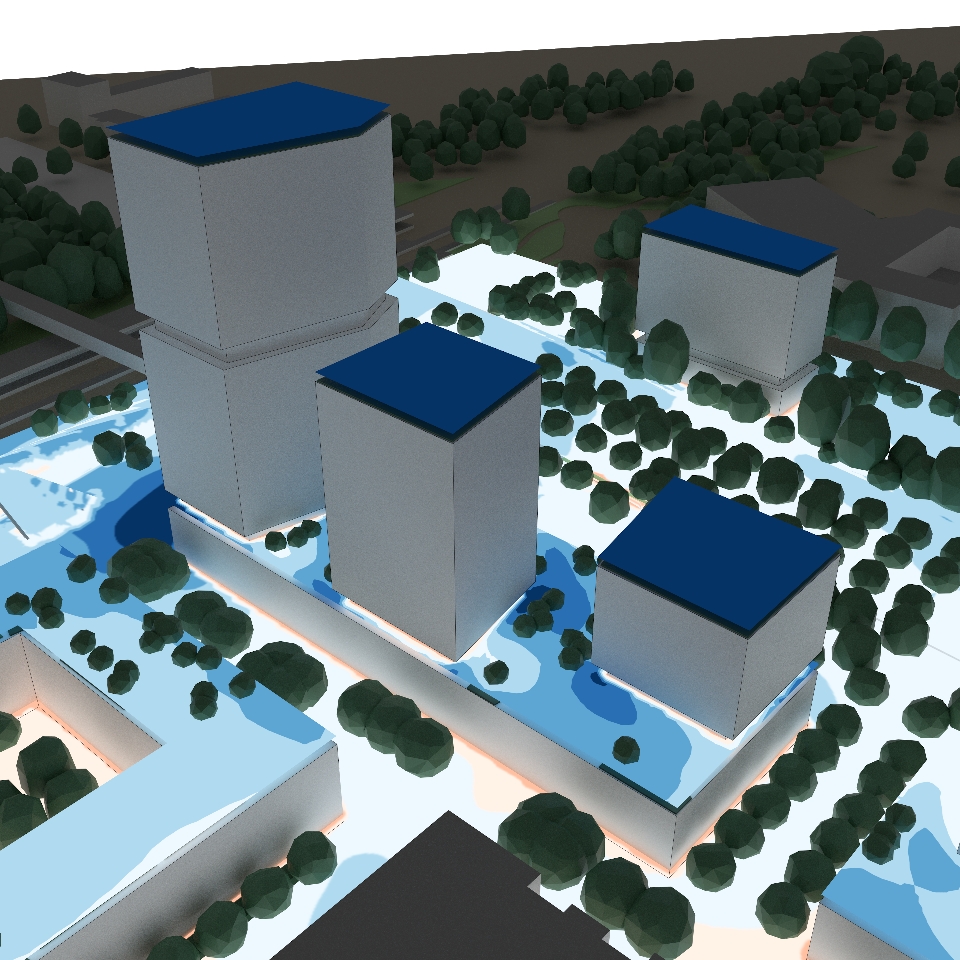
The microclimate simulation was done for a time span of 24 hours to specifically also allow an assessment of the nightly cooling, since the urban heat island effect is particularly pronounced during night time. A focussed analysis ensures that the urban fabric can cool down as much as possible overnight. As an example the images below show the felt temperature (UTCI) at 15:00 and 4:00 local time around one of the buildings of the project. The colored planes showing UTCI are at pedestrian level, 1.5 meters above publicly accessible areas. Additional renders are shown at the bottom of this article. A full, interactive model of the microclimate will be published after finalizing the results, to allow the general public transparent access to the planning process.
Wind comfort & biotope area factor
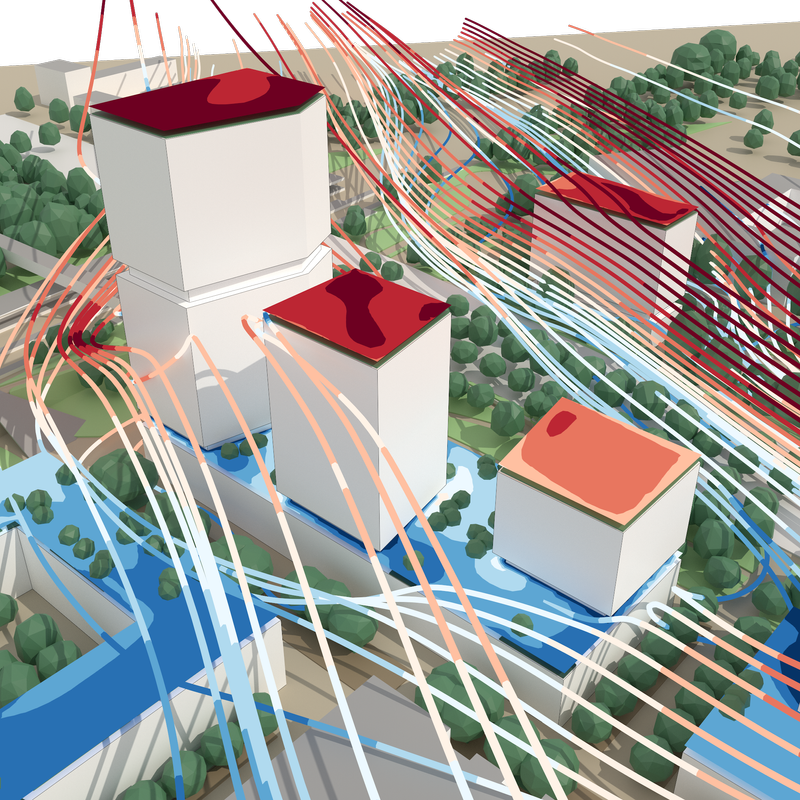
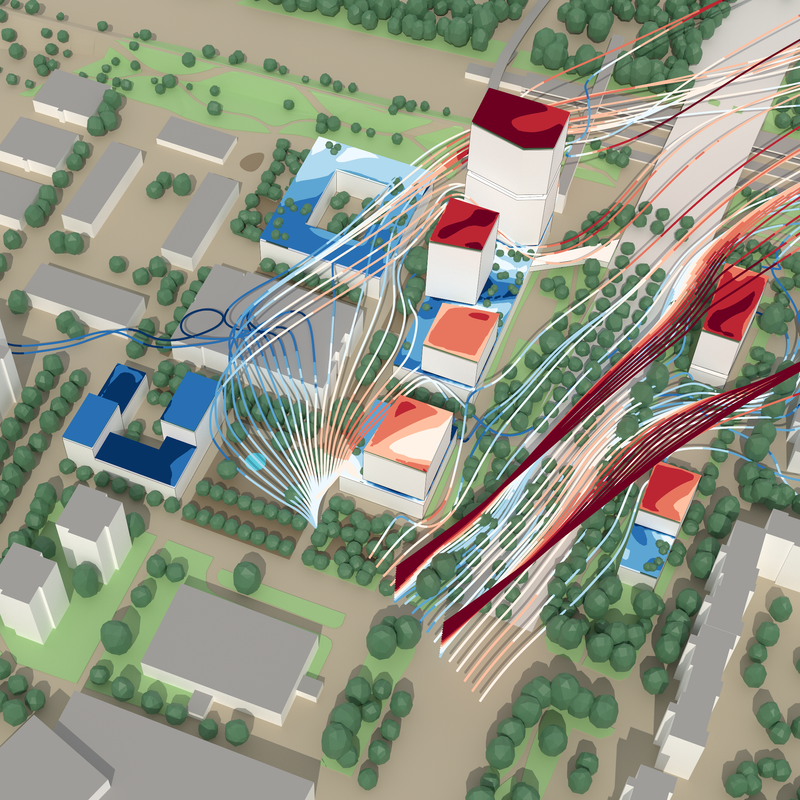
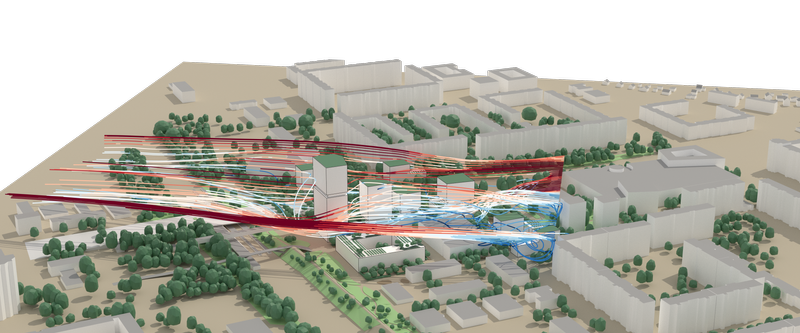
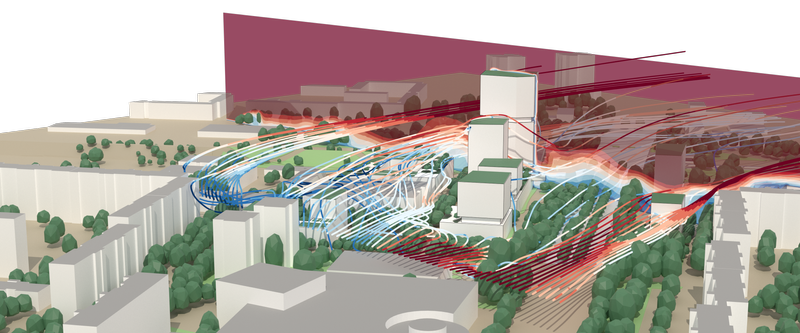
Besides the microclimate we also looked at the wind comfort for all wind directions with statistically weighted wind velocities and directions. To also assess ecological influences and rain water management we also calculated the Biotope Area Factor (BAF) (a system similar to the space-floor index but focussing on the ecological quality of urban blue and green spaces) and runoff factors. This facilitates a transparent and obliging, ecological planning process: certain target criteria have to be achieved in the master plan and can then be used to obligate the real estate developers accordingly to ensure that the master plan vision does not get watered down during implementation.
Weather and climate data for the simulation
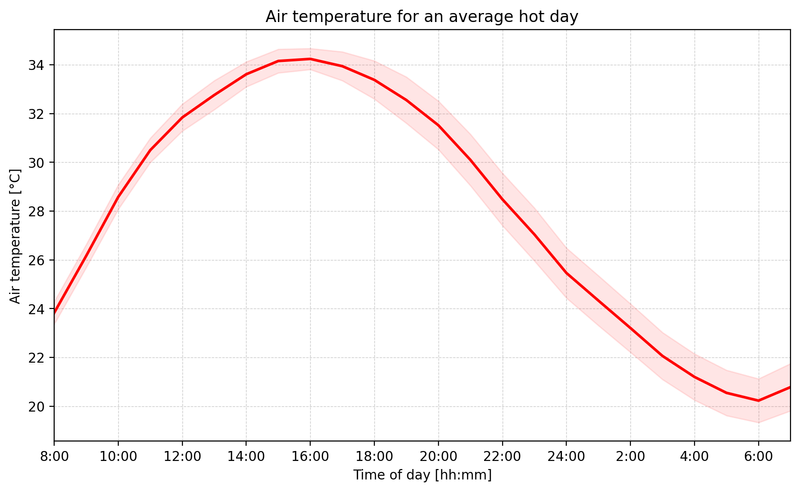
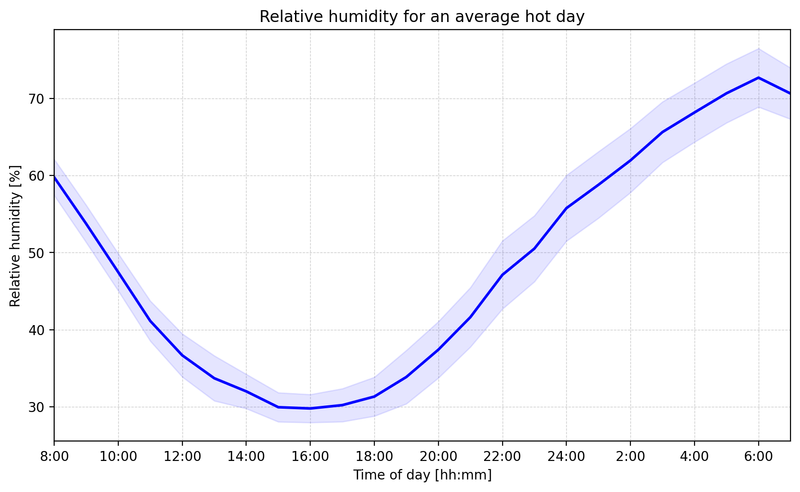
Weather data of the previous 10 years were analyzed for the simulation. The diurnal air temperatures and relative humidity for the hottest days were calculated and summer wind direction and velocity extracted from hourly measurement values. Additionally we included climate projections of the German Weather Service, so that the simulation shows a realistic picture of the local hot-weather conditions in about 20 years.


Published: